TL;DR
Increased indirect conversion rate by 5.32% through a data-driven redesign of hotel video covers, optimizing for user viewing behavior and sound preferences.
+5.32%
Conversion
Indirect rate
4.8%
Video CTR
vs 2.0% images
8.4%
Sound-On CTR
vs 1.1% muted
400M+
Active Users
Annual platform
1My Role & Context
My Responsibilities
Wireframing, prototyping, user testing, data analysis, and A/B test design
Team
Me (Product Designer), PM, 5 Dev Engineers, Design Manager
Tools
Figma, Sketch, Maze
🏢
Project Context: Well Group (design consultancy based in Shenzhen) was contracted by Ctrip (international OTA based in Shanghai) to improve the hotel browsing experience. I worked as the lead designer on this engagement.
2Understanding Ctrip
Ctrip is one of the world's largest online travel agencies, enabling seamless travel experiences for global users. The platform integrates technology with innovative services, empowering travelers to explore the world with confidence.
Annual Active Users
400 million+
Partnered Hotels
1.5 million+ worldwide
Global Presence
200+ countries and regions
Monthly Reviews
2 million+ verified
3Problems Identified
"To improve user experience in browsing image/video content"
Through UX audit and user testing, I identified multiple issues with the current video cover implementation:
- Content Issues: Video content not properly cropped—black edges appeared on many hotel listings
- Sound/Image Problems: No sound on detail page; video playback area too small for comfortable viewing
- Operation Friction: Videos too long with no pause control; 5G environment cues displayed unreasonably
- Technical Bugs: Progress bar not adapted to hotel overview card when sliding; video doesn't blend with reflection below
4Data Analysis
I conducted a deep dive into video performance metrics and user behavior data:
Video Source Analysis
70% of source videos are 16:9 ratio
Need optimized cropping for different screen sizes
Image Ratio Distribution
47.18% are 3:2, 34.98% are 4:3
Multiple formats require adaptive display logic
Engagement Metrics
Video CTR: 4.8% vs Image CTR: 2.0%
Videos significantly outperform static images
Sound Preference
Sound-on CTR: 8.4% vs Muted CTR: 1.1%
Users strongly prefer audio-enabled videos
💡
Key insight: The data showed users want immersive video experiences with sound—contrary to the assumption that muted autoplay was better for UX. This counter-intuitive finding drove our solution.
Design Decision
Video covers as social proof, not decoration
Data showed static images had declining click-through rates, but simply adding video wasn't enough — users needed to see real guest experiences within 3 seconds. I designed video covers to auto-play the most engaging 3-second clip (selected by AI) with a progress indicator, turning passive browsing into active engagement. A/B testing confirmed a 5.32% indirect conversion lift.
5Design Showcase
Complete analysis and solution design for the hotel cover upgrade:
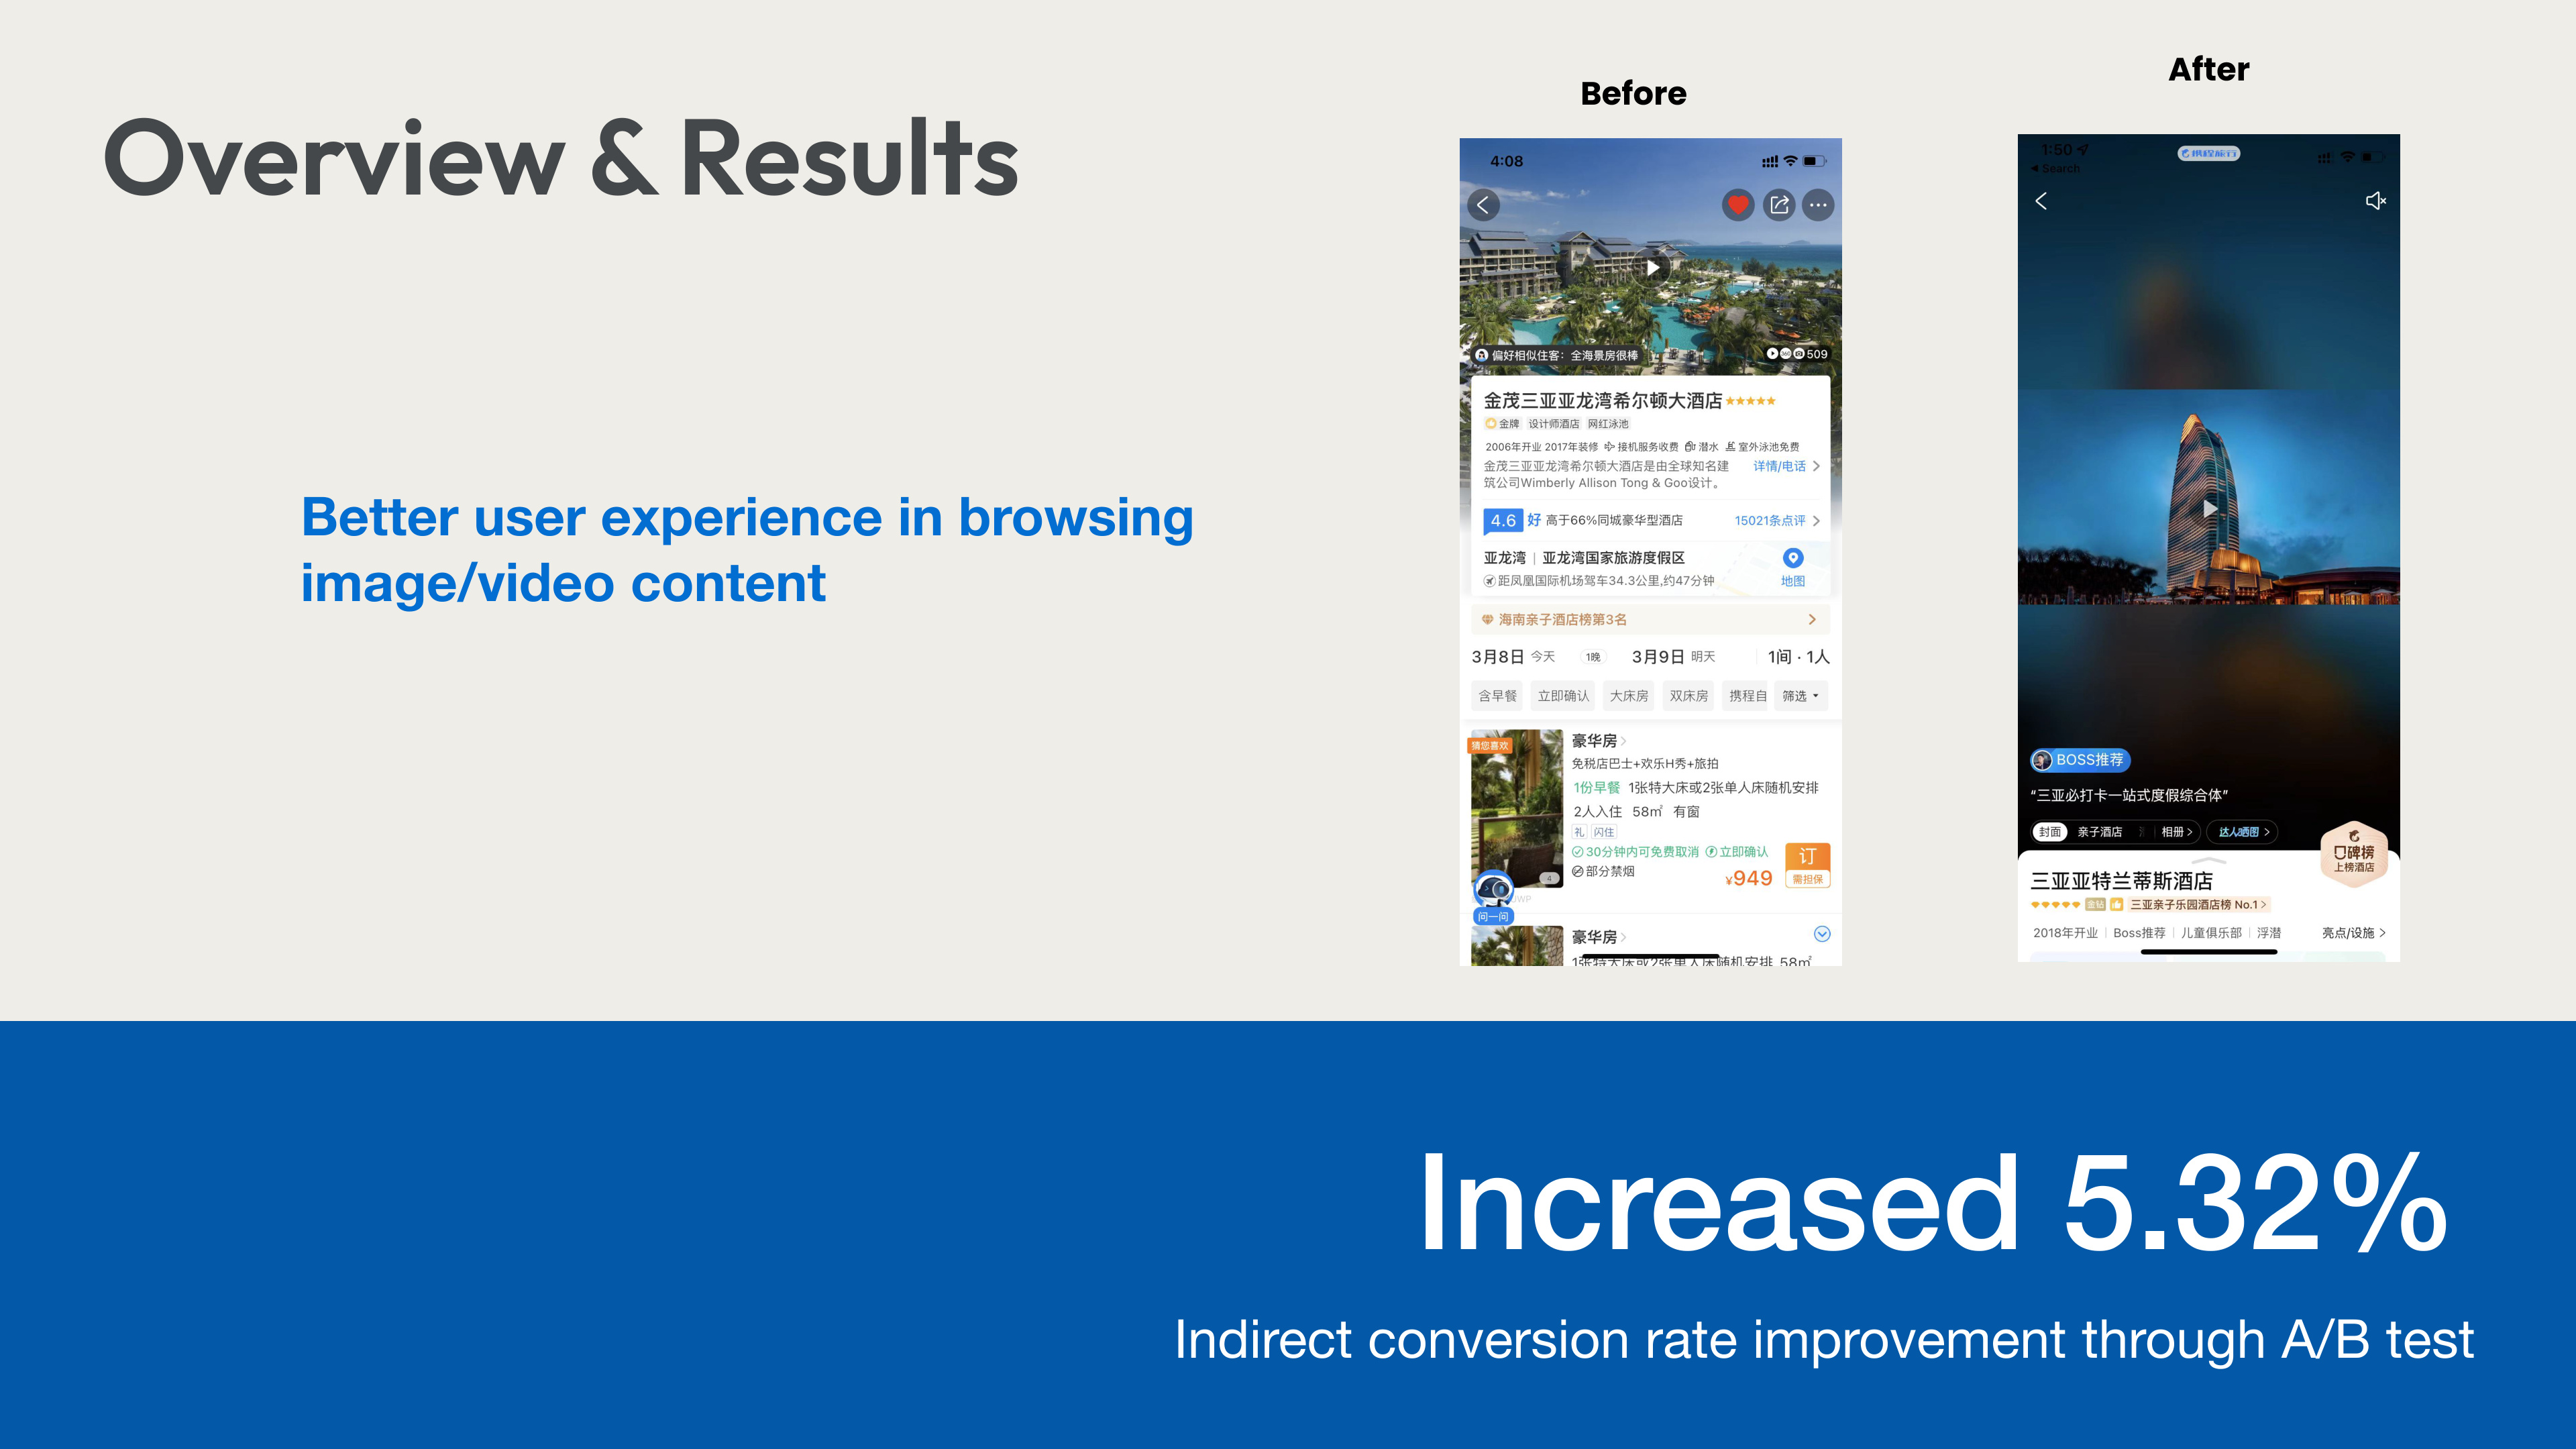
Overview & Results — 5.32% indirect conversion rate improvement via A/B testing
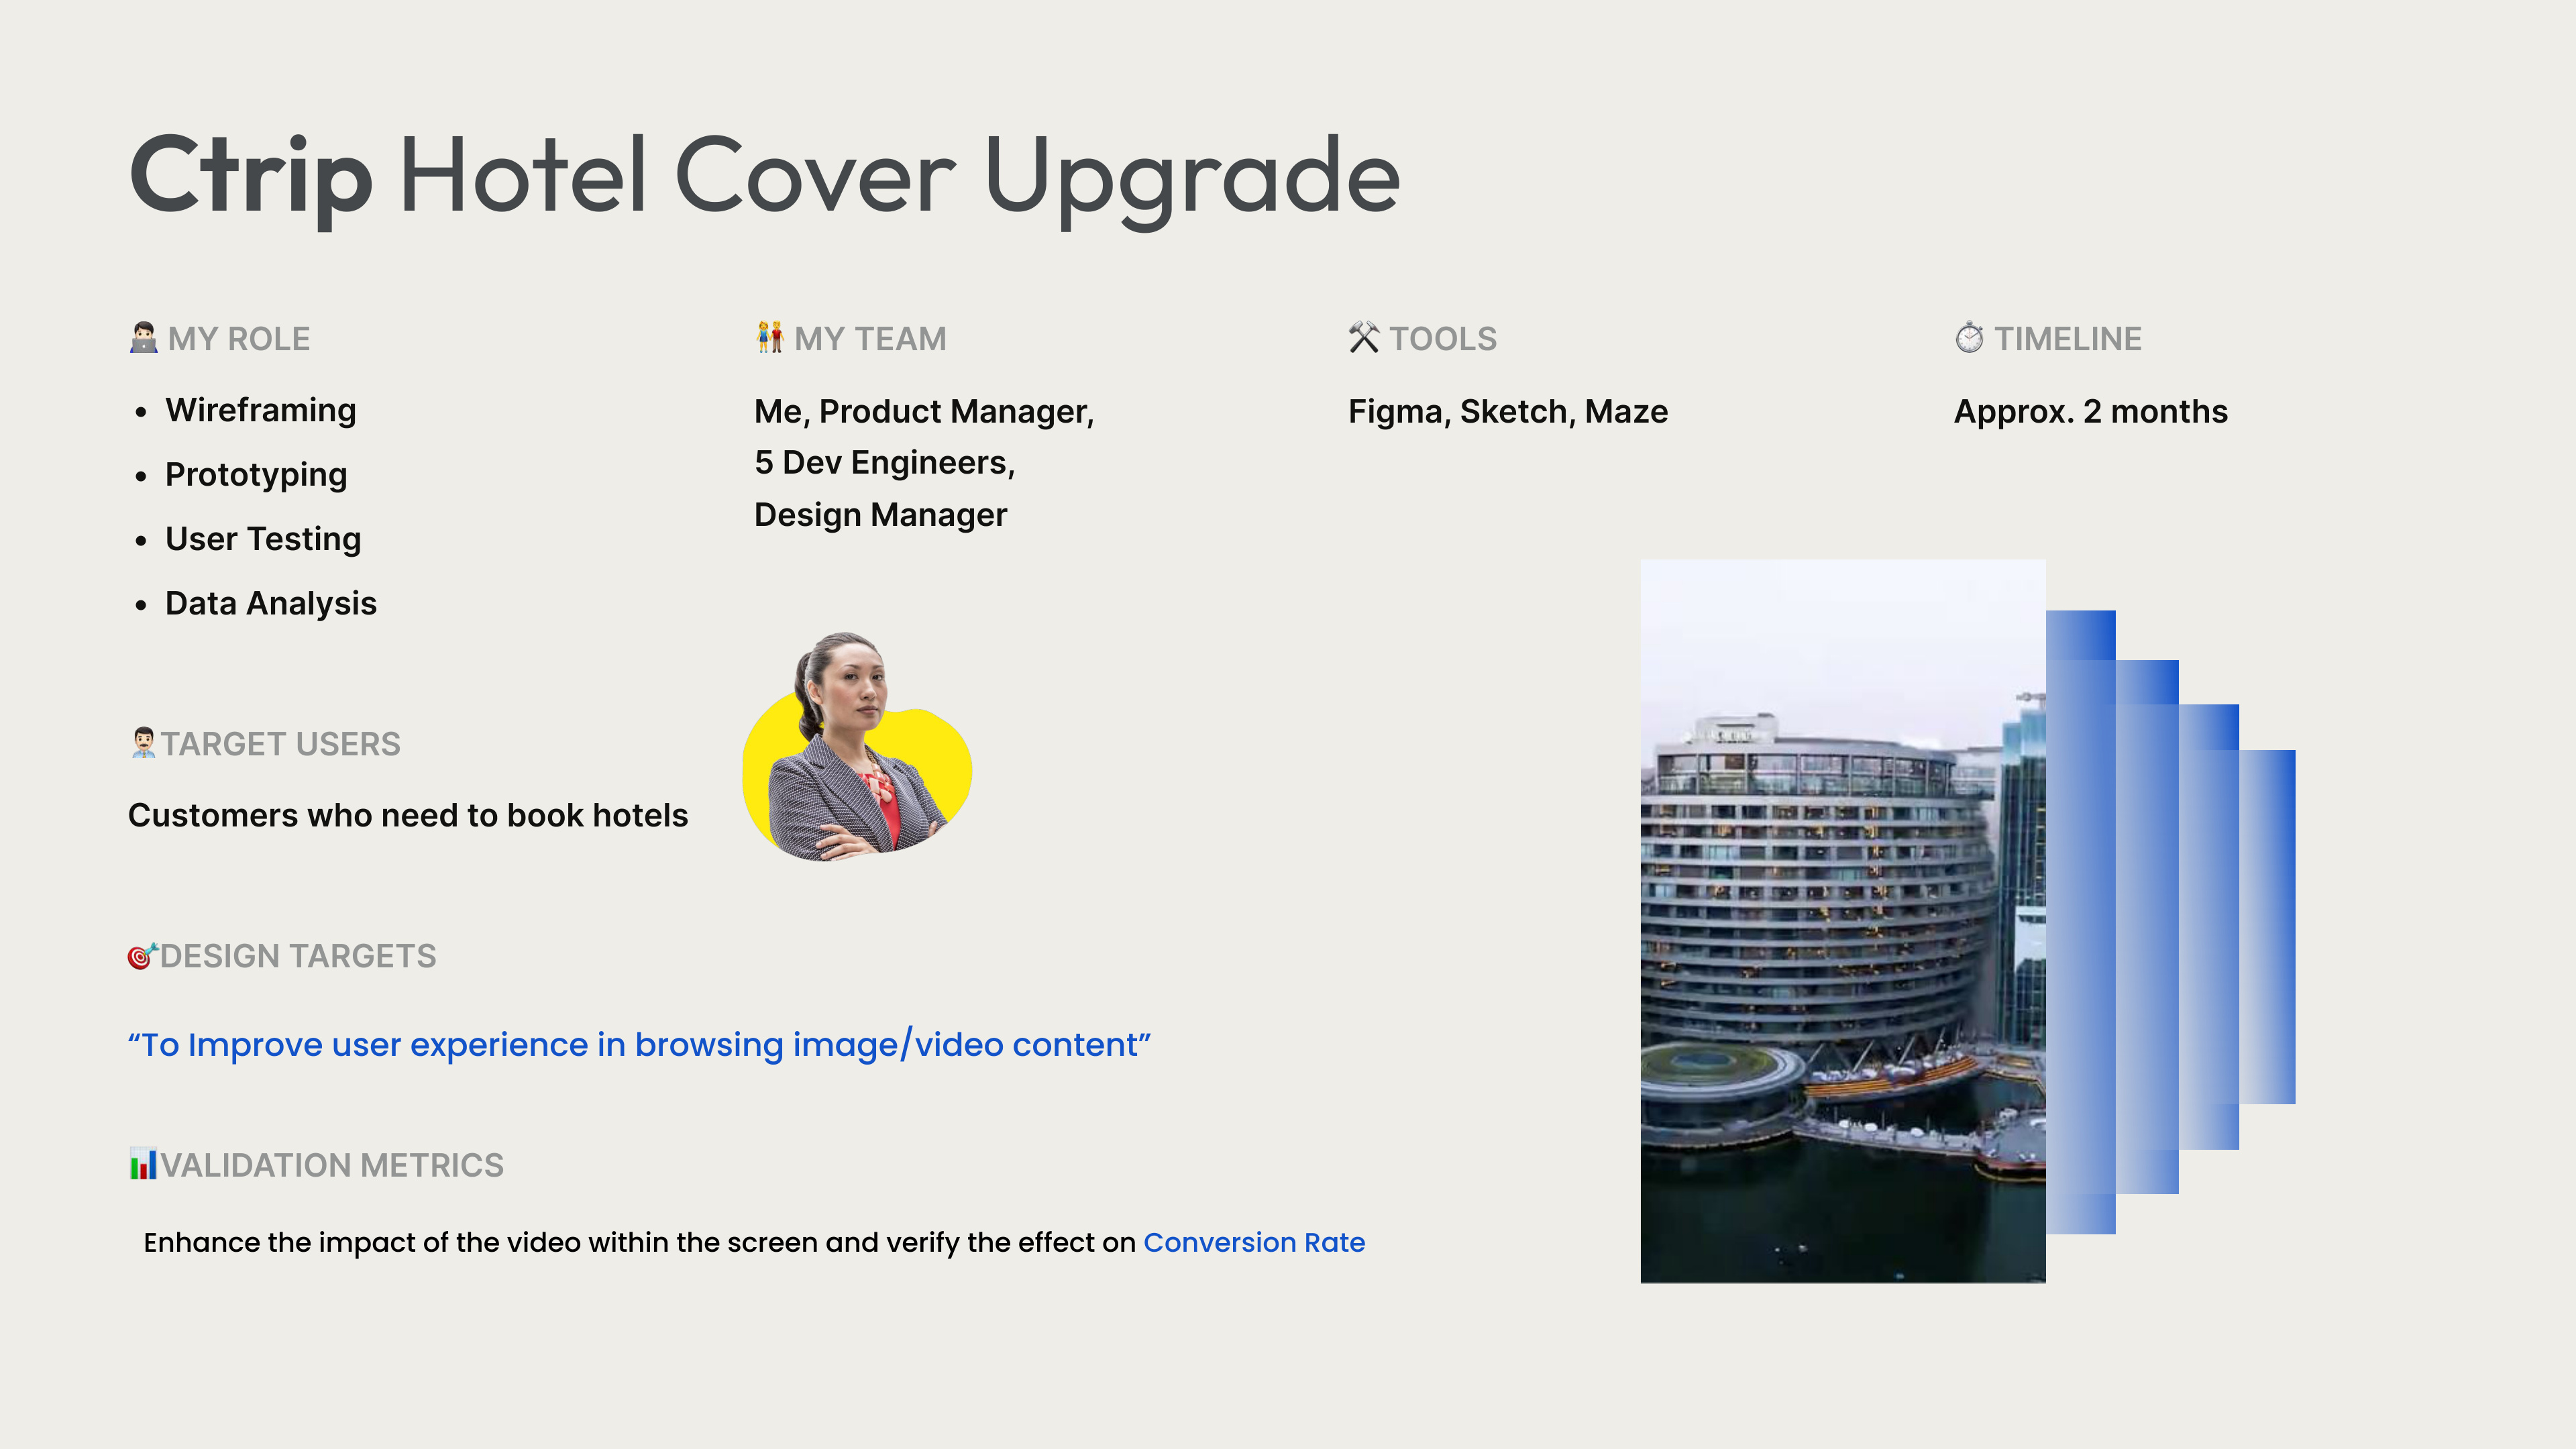
My Role — wireframing, prototyping, user testing, and A/B experiment design
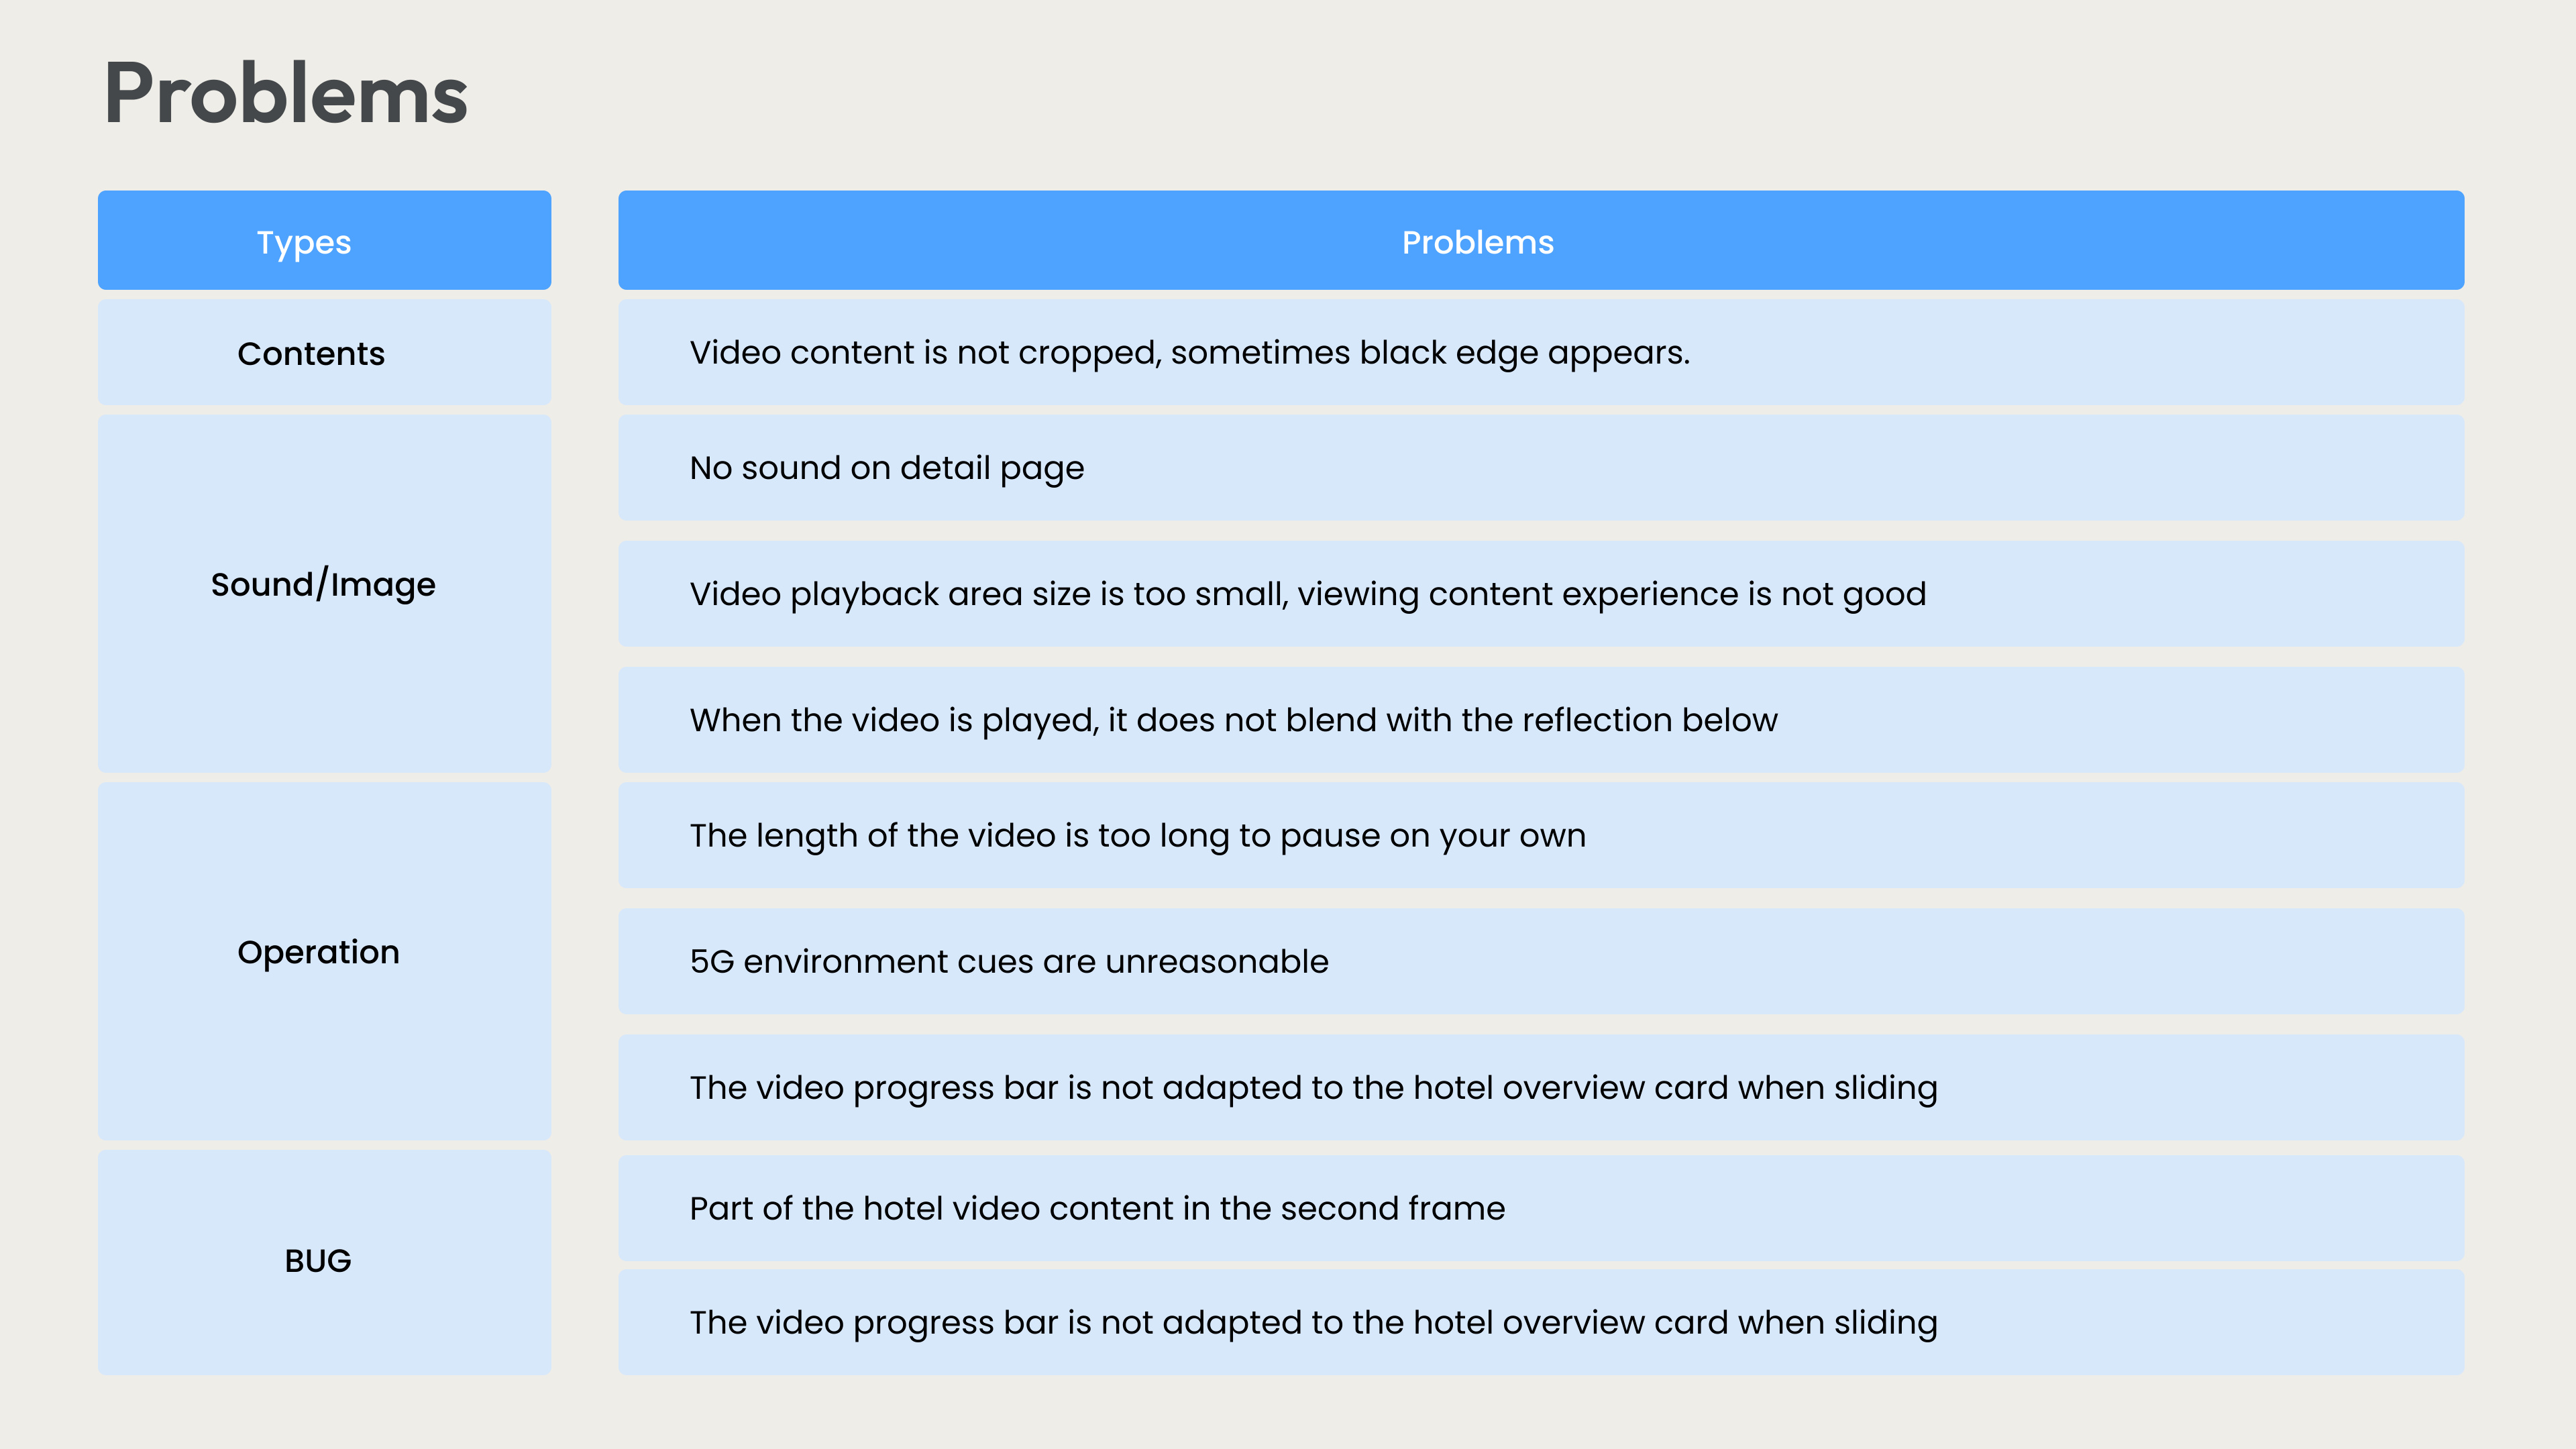
Problem categorization — Content, Sound/Image, and Operation issues identified
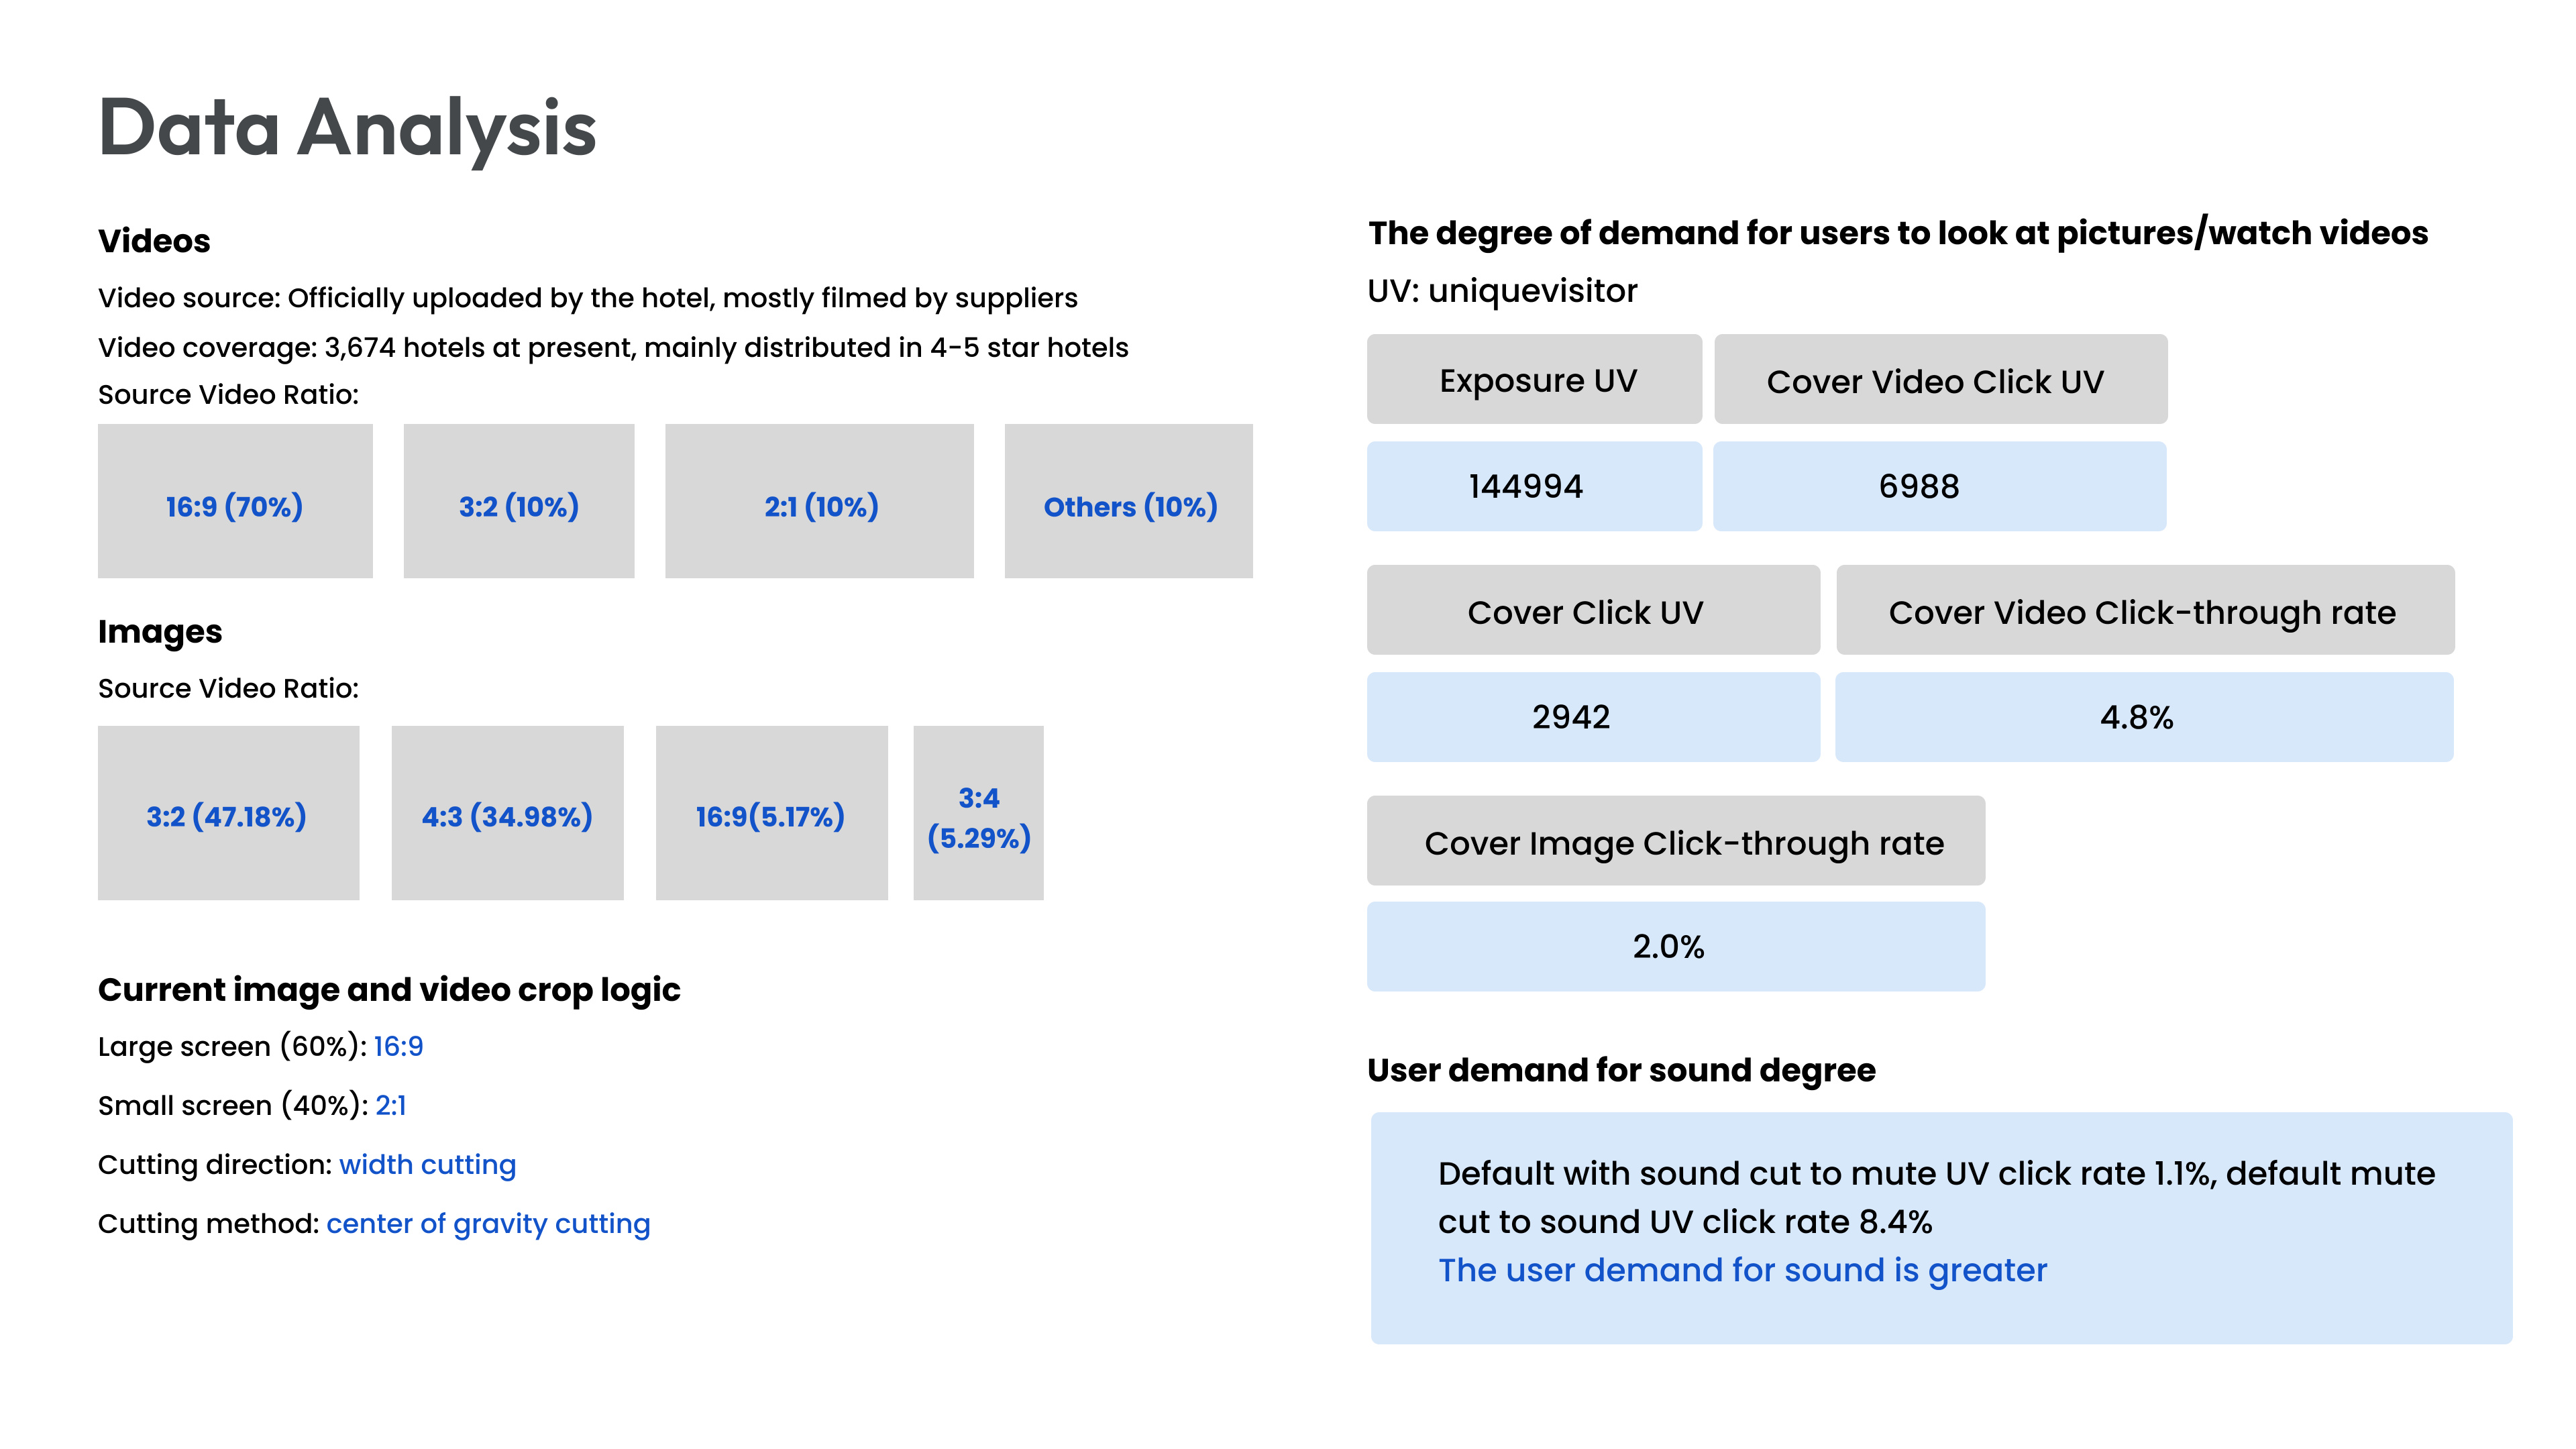
User demand analysis — video/image viewing patterns and crop logic study
6Solutions Delivered
Adaptive Cropping Logic
Smart cropping based on screen size: 16:9 ratio for large screens (60% of users), 2:1 ratio for small screens (40%). Cropping direction prioritizes width, using center-of-gravity detection to preserve key content.
Sound Enhancement
Default sound-on with easy user control. Based on data showing 8.4% CTR with sound vs 1.1% muted, we reversed the previous silent-first approach while respecting user preferences.
Progress Optimization
Redesigned progress bar that adapts to card sliding behavior. Progress indicator now properly syncs with video playback and responds to user swipe gestures.
Content Guidelines
Established new standards for hotel video uploads: recommended ratios, length limits, quality requirements, and content guidelines to ensure consistent user experience.
💭 What I Learned
This project reinforced that assumptions kill design. Everyone "knew" that muted autoplay was the industry standard—but data showed our users were different. Working with a platform serving 400M+ users taught me to let data lead while staying curious about outliers. The 5.32% conversion lift came from a series of small, data-validated improvements—not one big redesign. Sometimes the most impactful design work is fixing what's broken, not inventing what's new.
