Enterprise B2B · 2021-Present
Signals Notebook
Lineage Visualization for Pharmaceutical Giants
Impact Snapshot
TL;DR
Reduced lineage tracing time by 66% (from 2 hours to 40 minutes) by designing an interactive visualization system for tracking complex biological material relationships in pharmaceutical research.
Pain
Scientists needed 2+ hours to reconstruct one material lineage.
Decision
Make the lineage map primary, with tables as evidence support.
Result
Tracing time dropped from 2 hours to 40 minutes.
Evidence
Scaled inside a $100M+ enterprise product context.
+20%
NPS Score
25 → 30
-66%
Tracing Time
2hrs → 40min
$100M+
Annual Revenue
Contribution
1M+
Workflows
Annually
1My Role & Context
My Responsibilities
End-to-end product design: wireframing, prototyping, user testing, design handoff, and cross-functional collaboration
Team
Me (Sr. Product Designer), 1 Product Manager, 10 Dev Engineers
Timeline
~5 months (2021-Present)
Tools
Figma, Jira, Confluence, Miro
2Understanding the Product
Signals Notebook is an AI-powered electronic lab notebook (ELN) trusted by over 10,000 scientific teams worldwide. It connects with ChemDraw, Spotfire, and lab instruments via APIs, supporting over 1M workflows annually.
Key Clients: Pfizer, Roche, Novartis, Johnson & Johnson, Takeda, Moderna, GSK, Merck, AstraZeneca, Bayer, and more. These pharmaceutical giants rely on our software for mission-critical research.
3The Challenge
“Scientists spent 2+ hours just to trace where a single cell line came from”
Through user interviews with lab researchers at major pharmaceutical companies, I uncovered critical pain points:
- Data Fragmentation: Lineage data was scattered across different experiments, tools, and formats—making it error-prone to piece together a complete history.
- Complex Relationships: Biological materials (cell lines, proteins, antibodies, viral vectors) have layered parent-child connections that existing tools couldn't visualize clearly.
- Scalability Issues: As research grew, systems struggled to handle large datasets and real-time collaboration.
- Non-Technical Users: Current visualization tools were designed for data scientists, not bench scientists who needed quick answers.
4Competitive Analysis
I evaluated existing solutions in the life sciences industry:
WormWeb
✓ Simple, interactive lineage tracking for model organisms
✗ Lacks scalability for complex biologics workflows
LabKey
✓ Flexible data integration and lineage grids
✗ Struggles with real-time collaboration and large datasets
IDBS
✓ Robust cell line genealogy and compliance features
✗ Complex interfaces for non-technical users
Key insight: Scientists don't think in database queries—they think in relationships. "Where did this cell line come from? What experiments used it? What batches were derived from it?" The solution needed to mirror this mental model.
Design Decision
Map-first visualization over table-first approach
Competitors all default to table views. But user interviews revealed scientists think in relationships, not rows. I chose an interactive map as the primary view with table as secondary — matching their mental model of biological lineage. This reduced tracing time by 66% because users no longer had to mentally reconstruct hierarchies from flat data.
5Design Process
I designed a streamlined workflow that lets scientists trace lineage in seconds instead of hours:
1
Materials Smart Folder
2
Select Material
3
Go to Lineage Tab
4
View Map & Table
5
Configure & Export
6Design Showcase
Complete design flow for the Lineage Visualisation feature — from existing state to final high-fidelity screens:
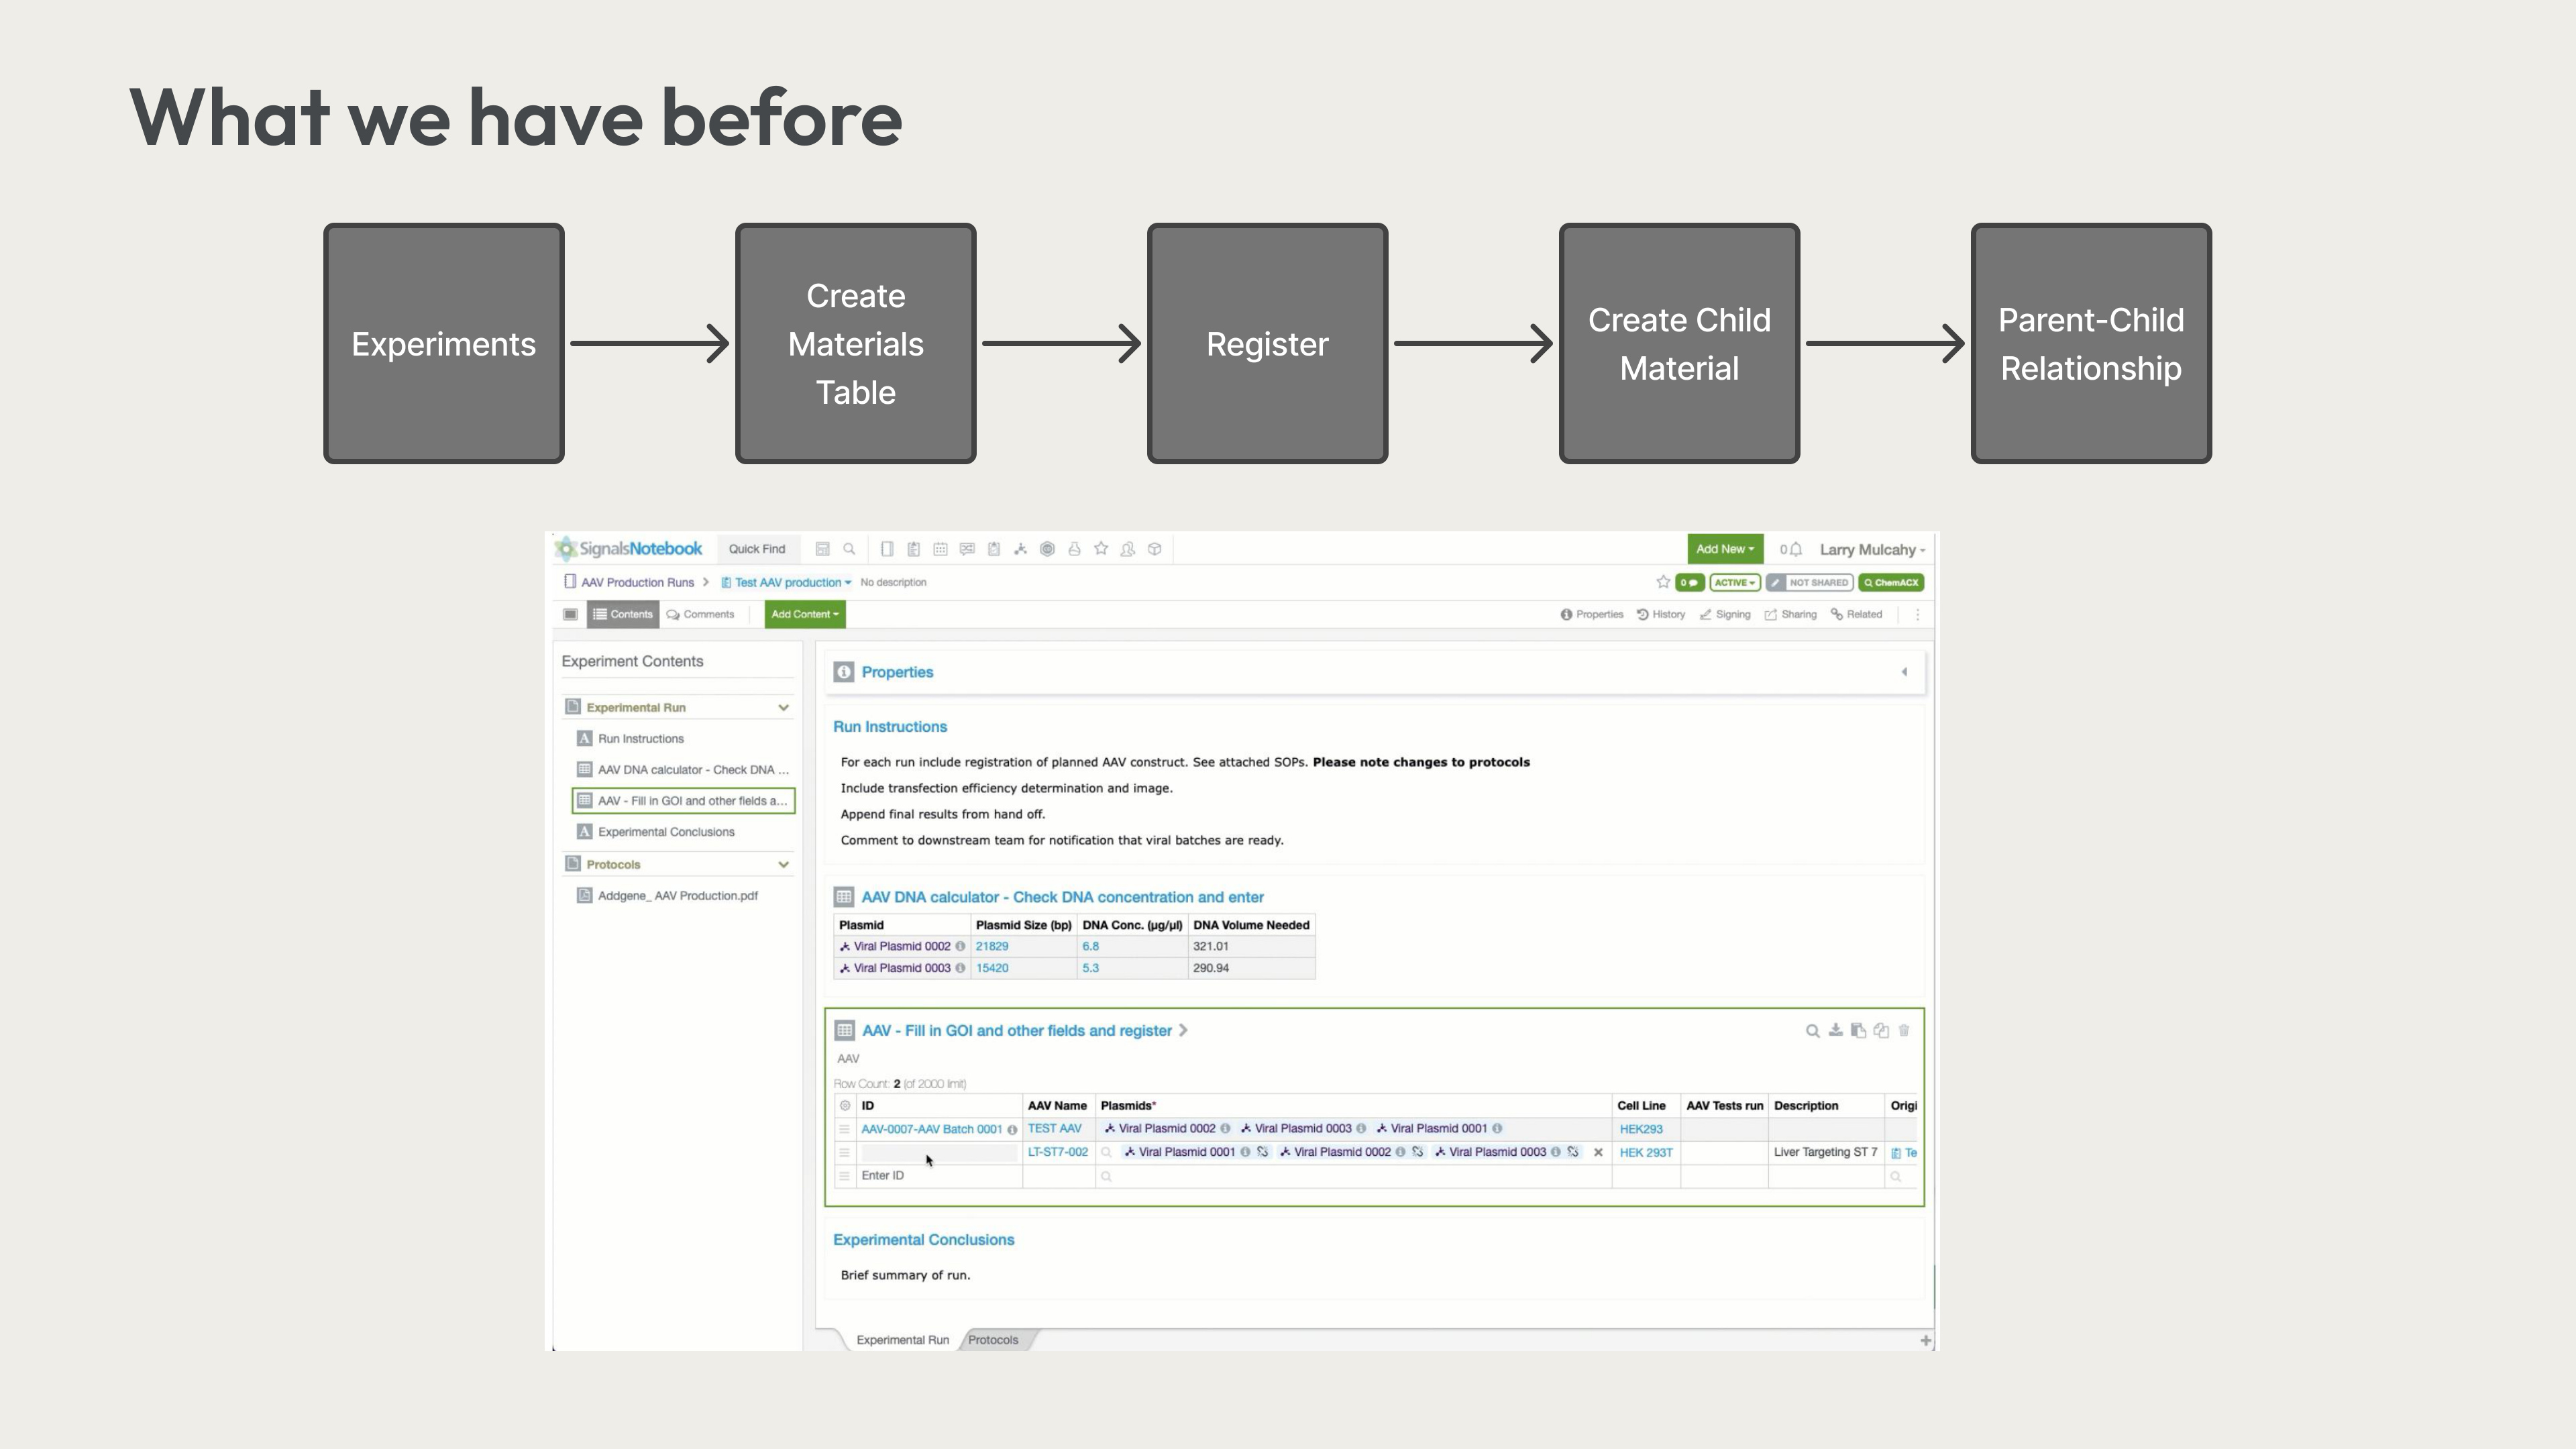
Before: Existing experiments table — lineage data scattered across views
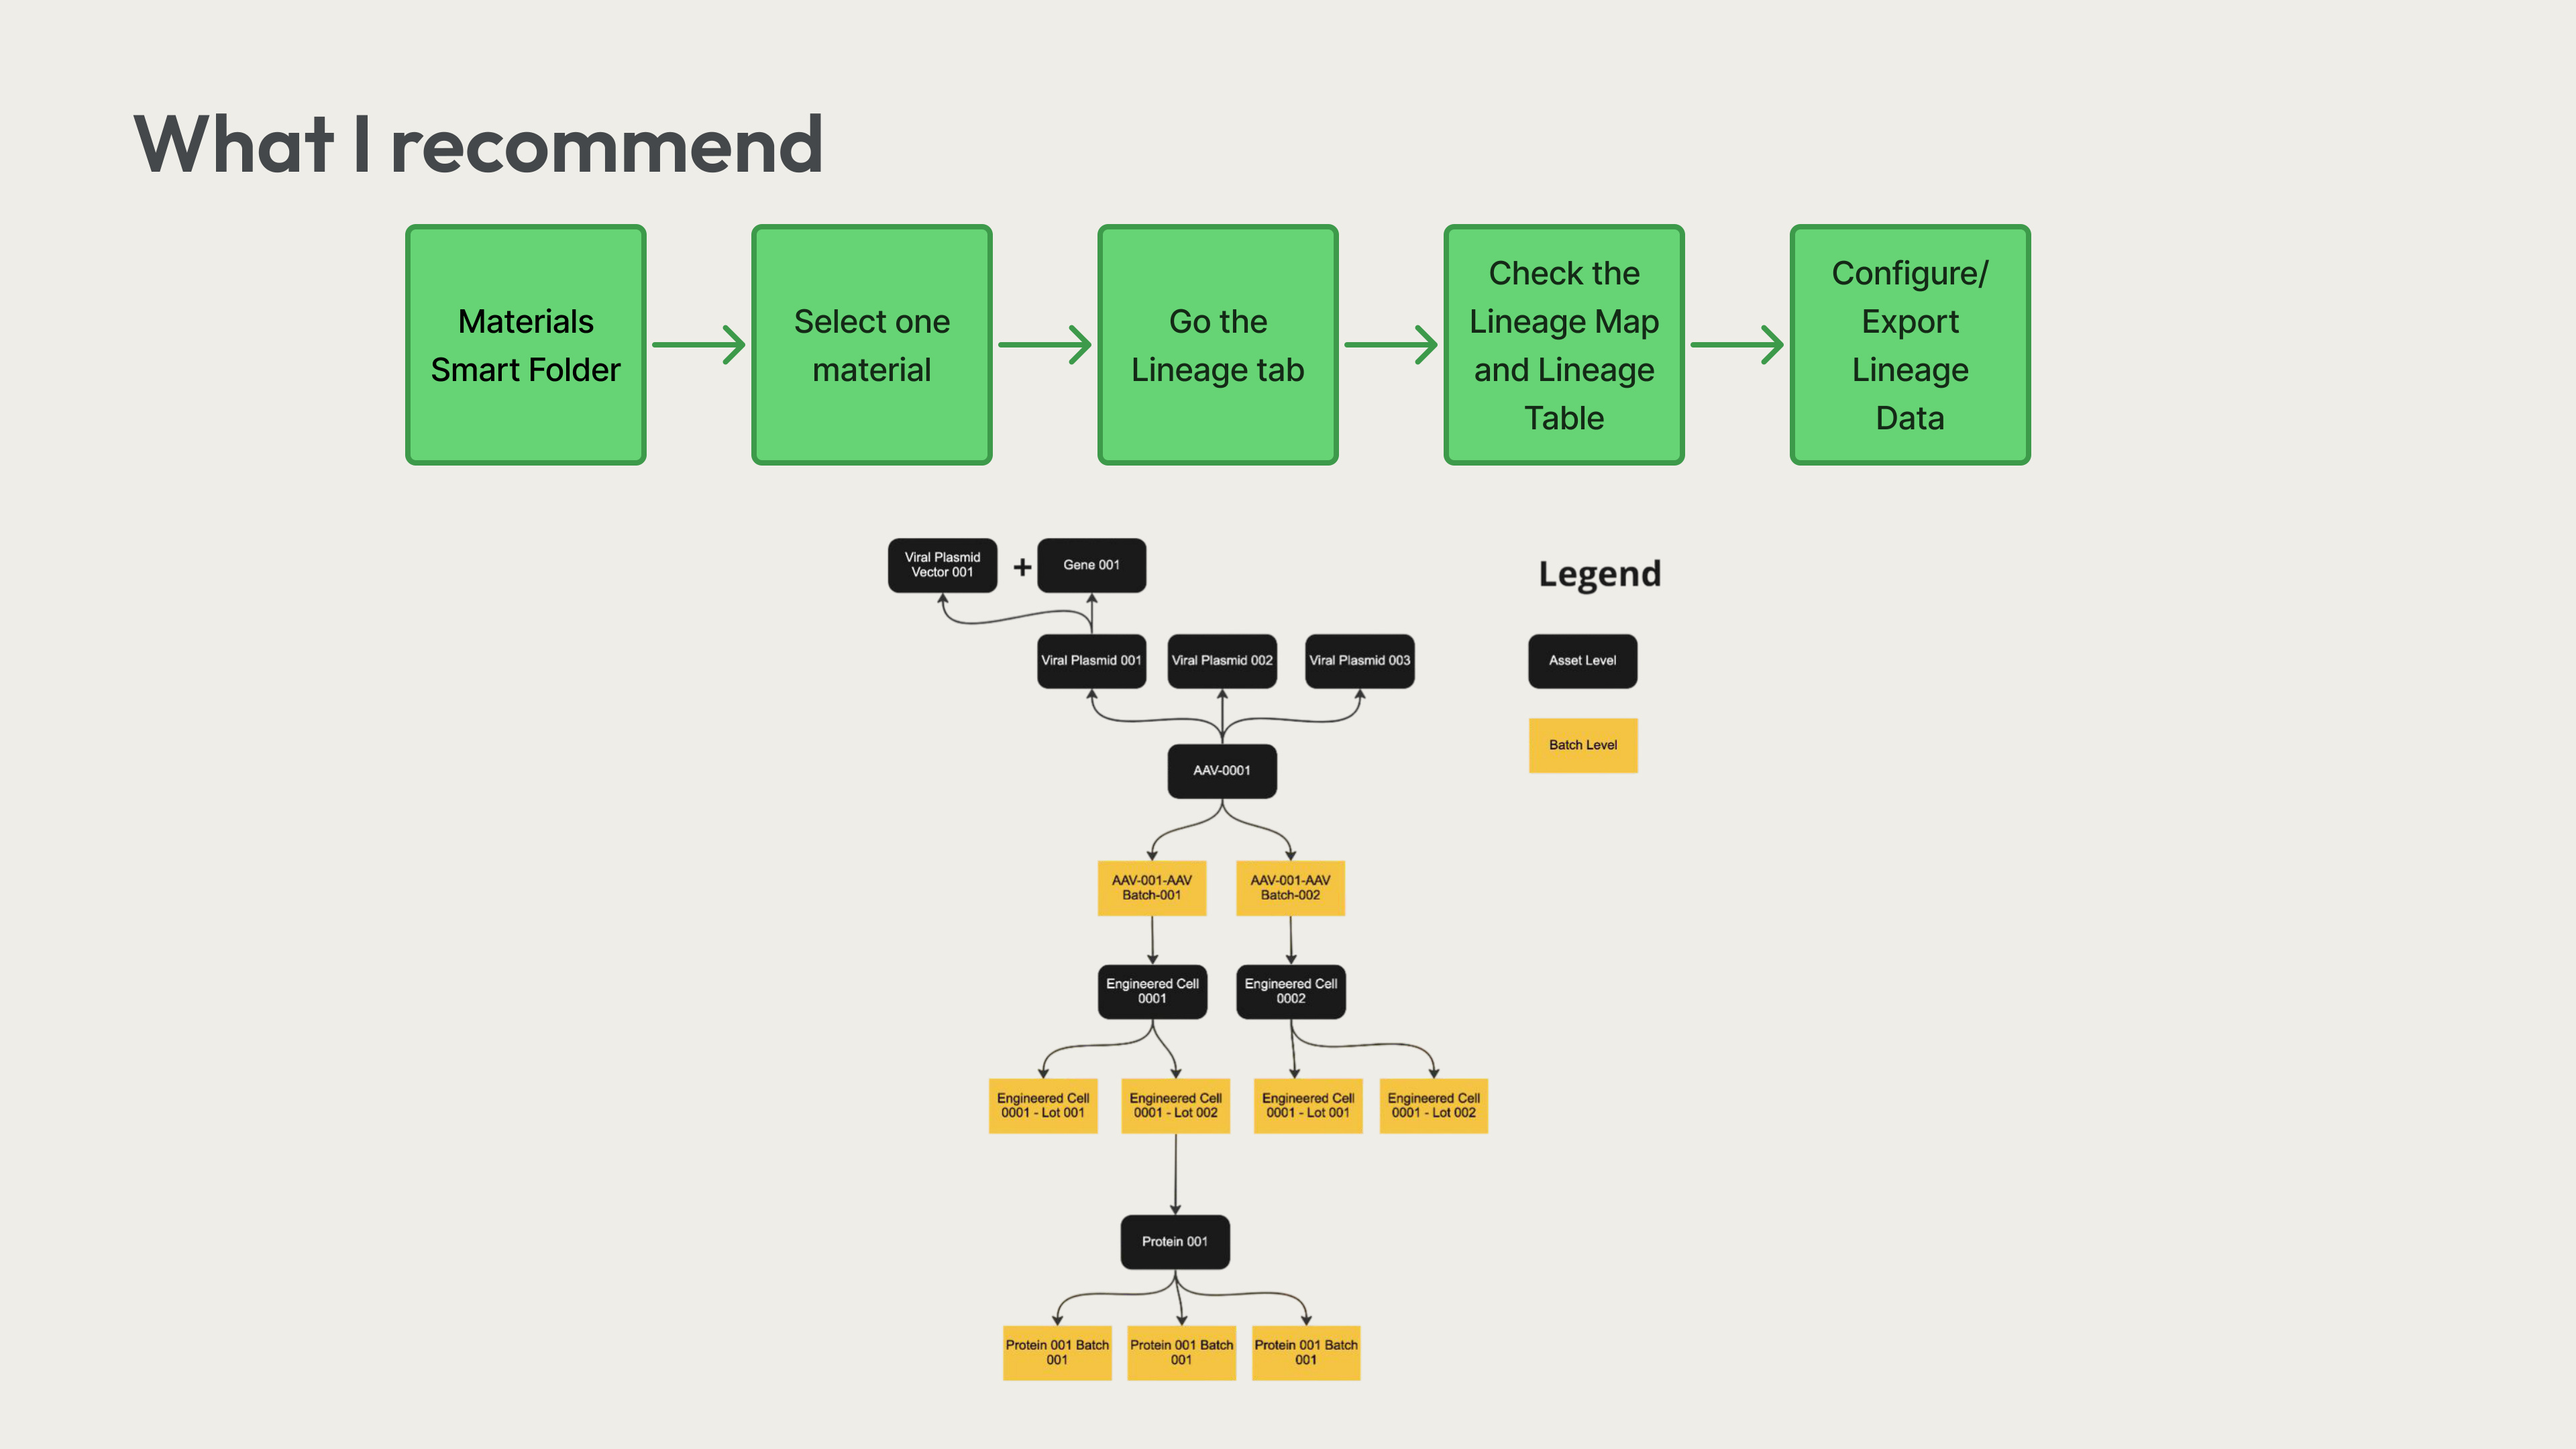
Recommended: Materials Smart Folder with unified search and filtering
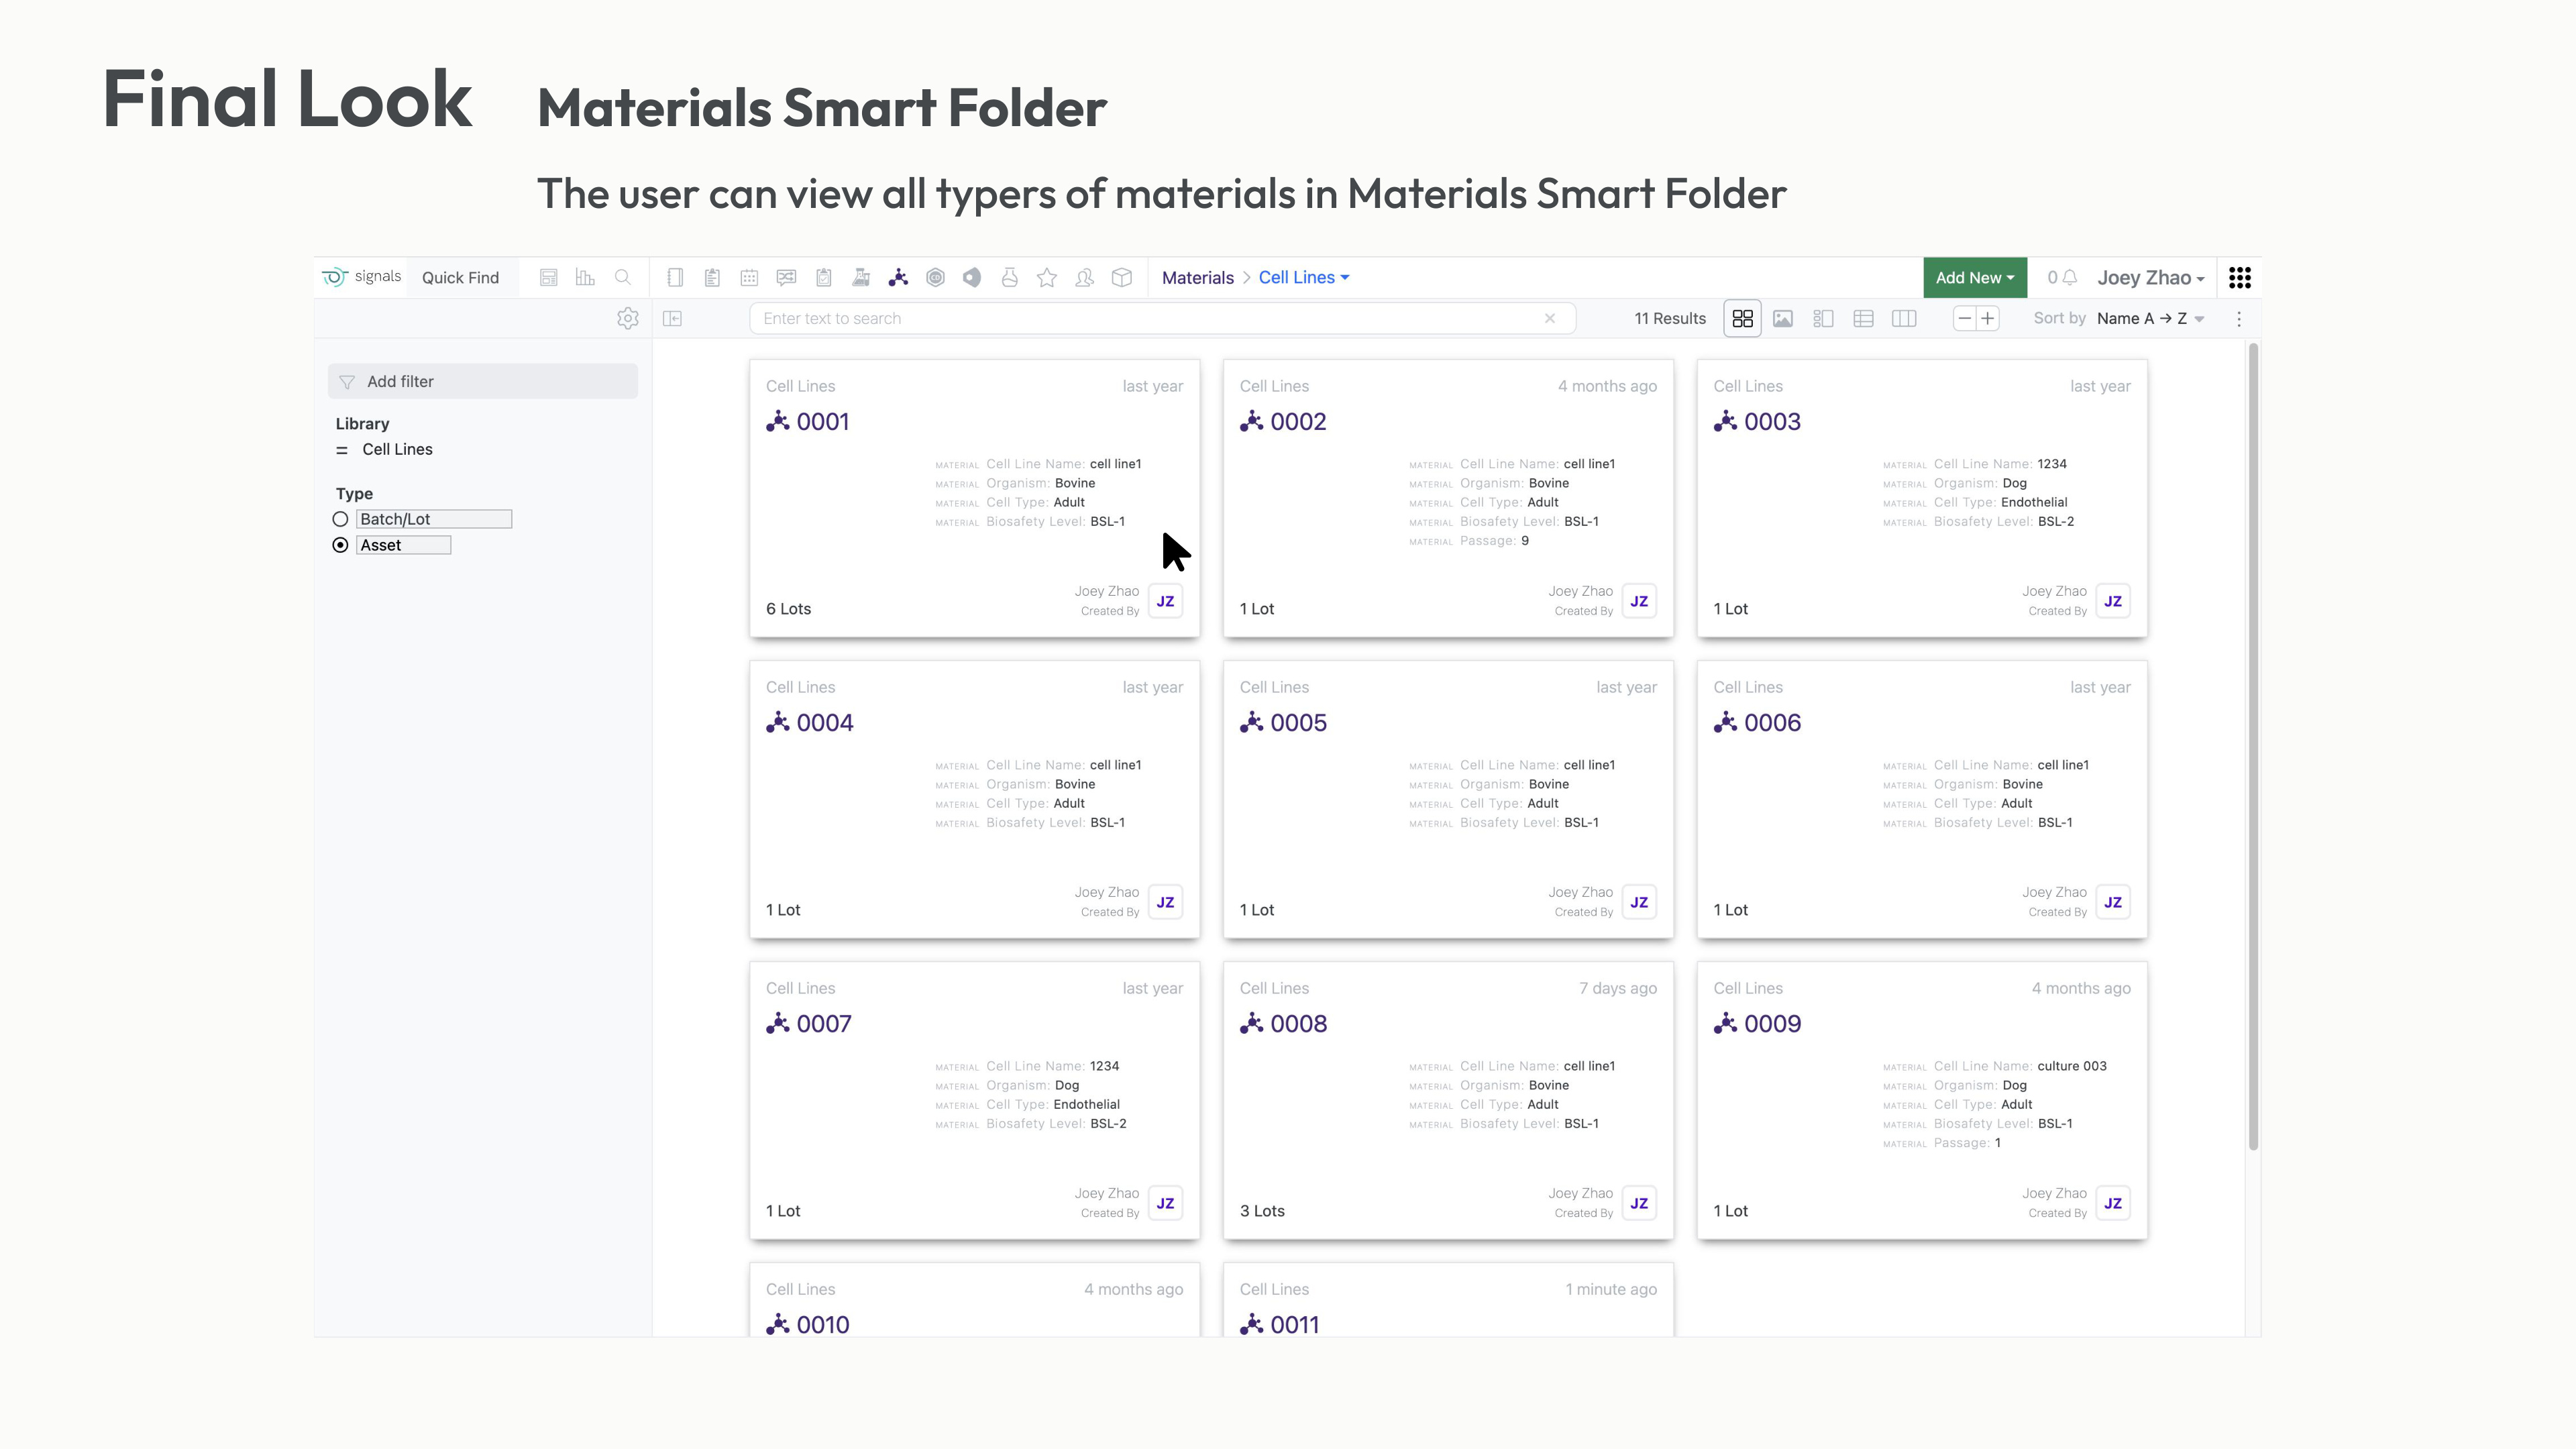
Materials Smart Folder — view all material types in one interface
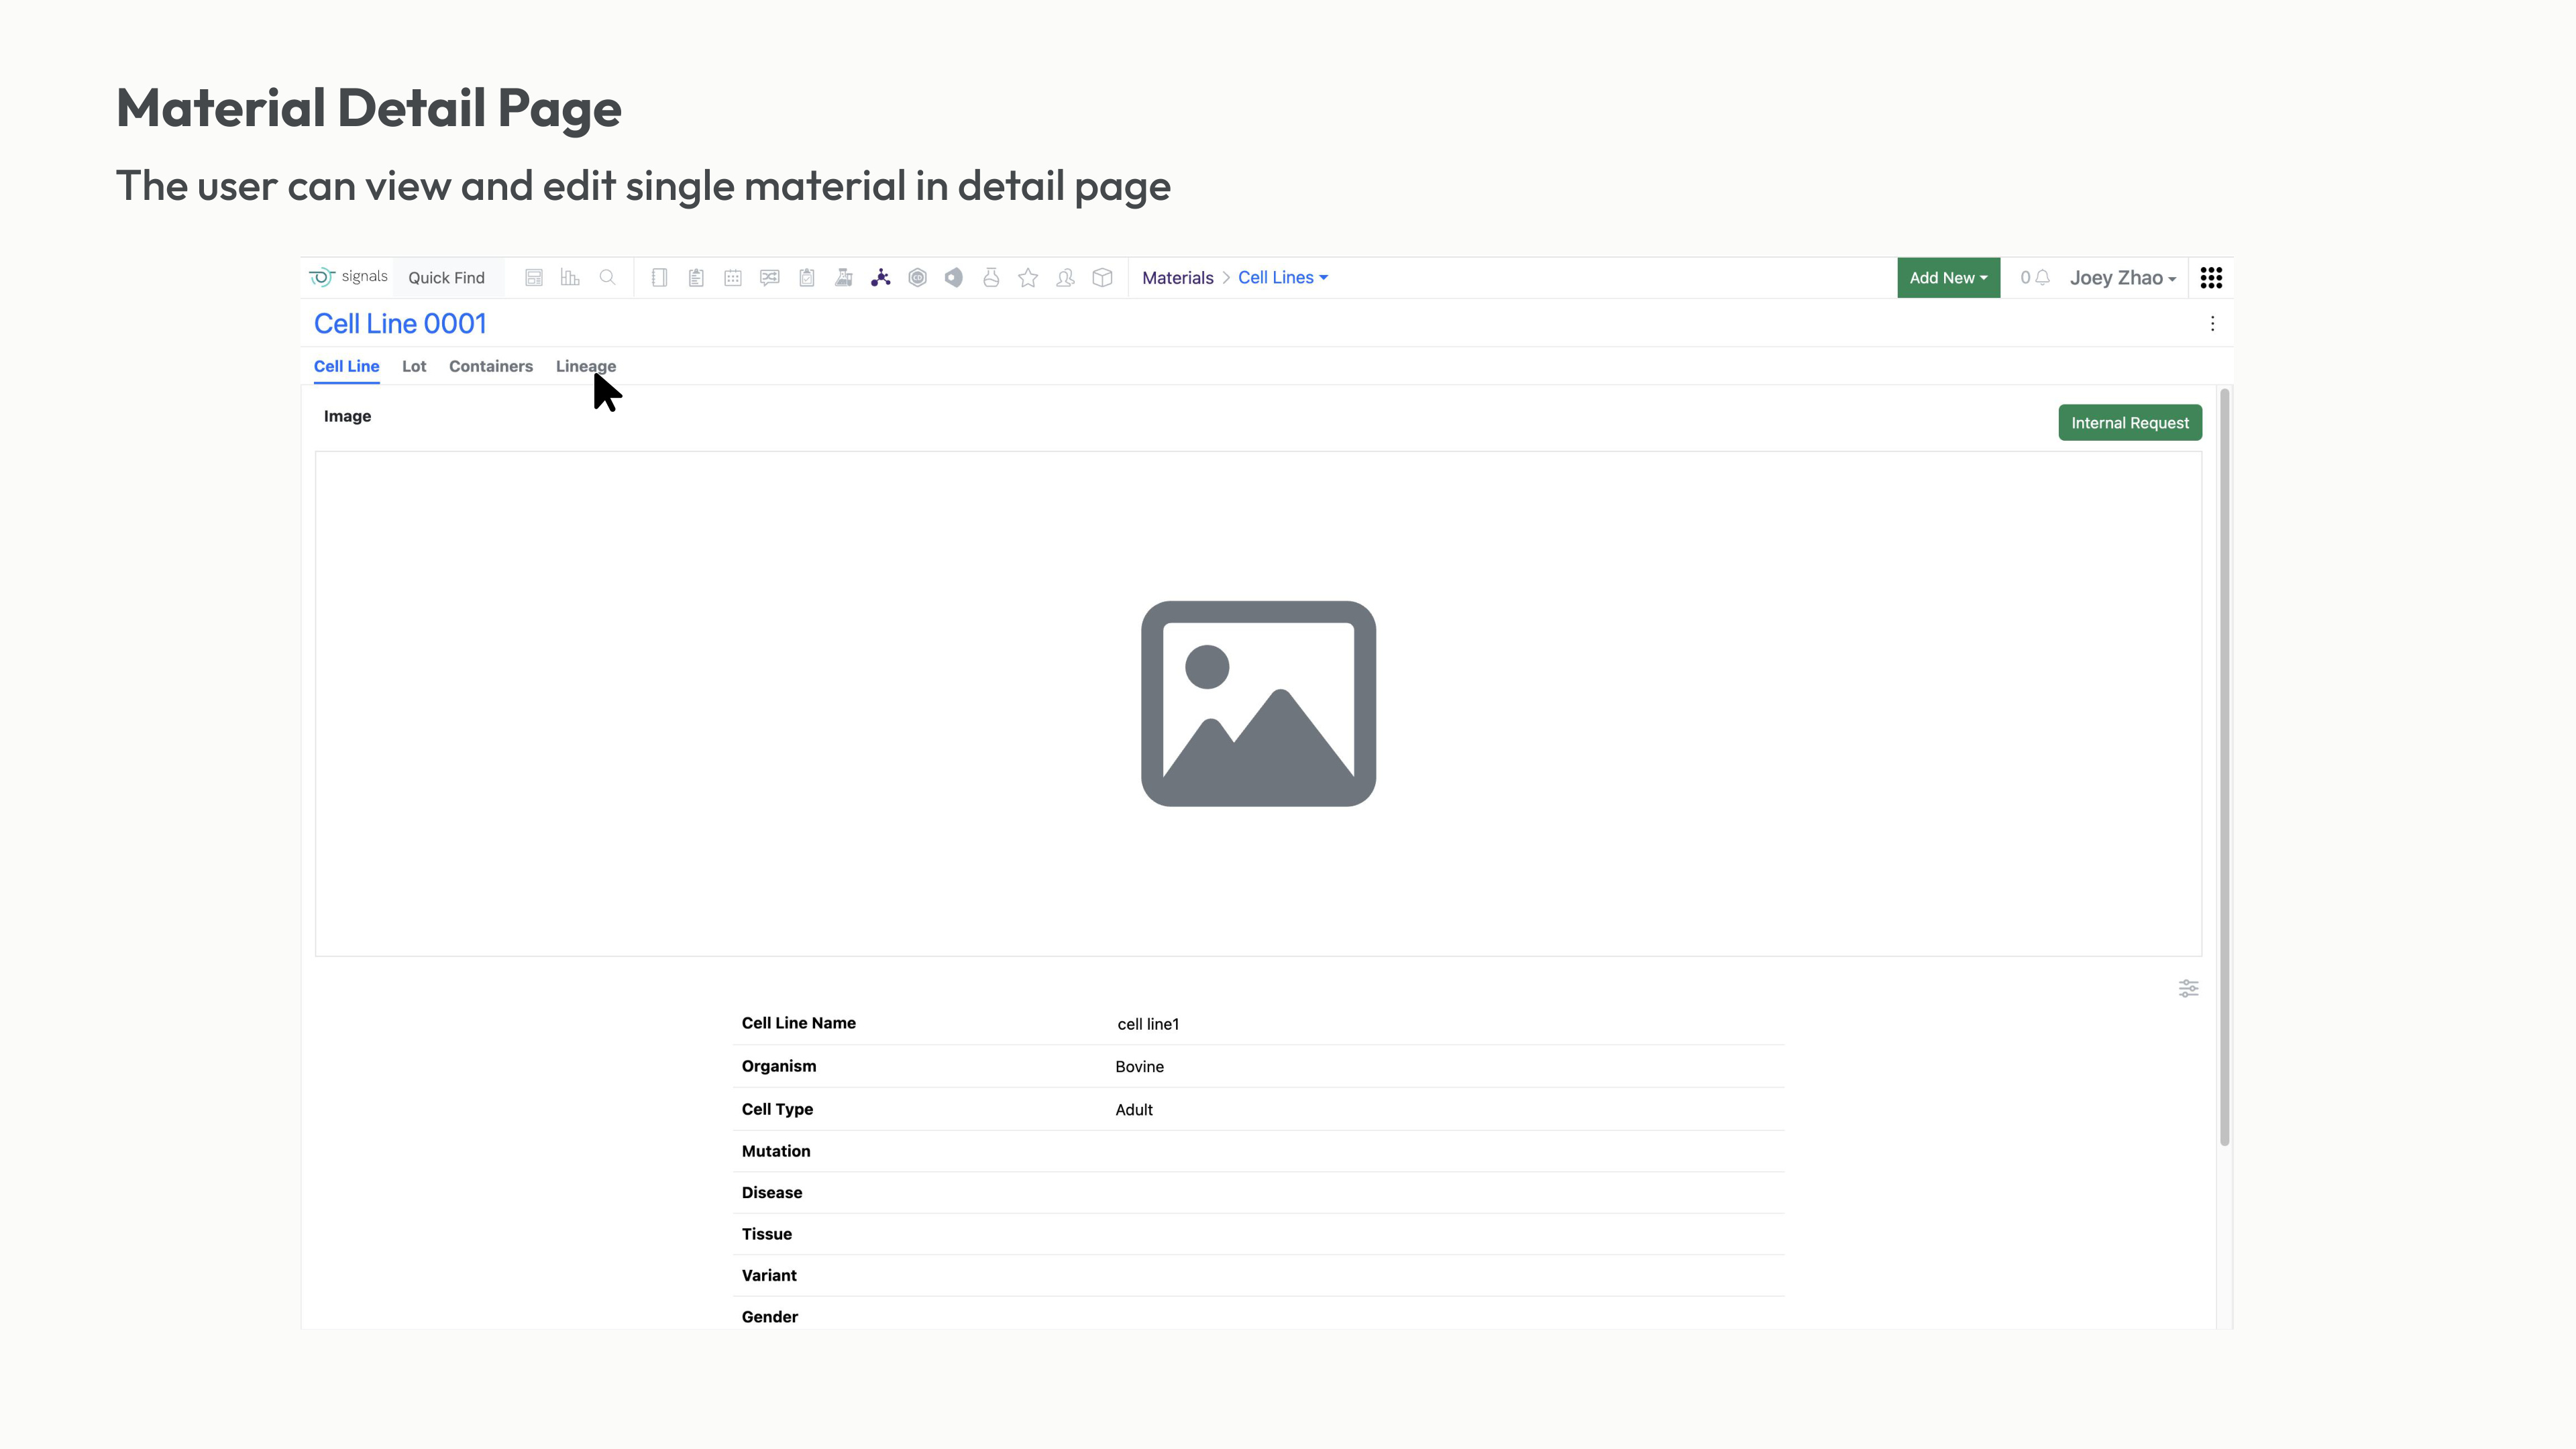
Material Detail Page — view and edit single material properties
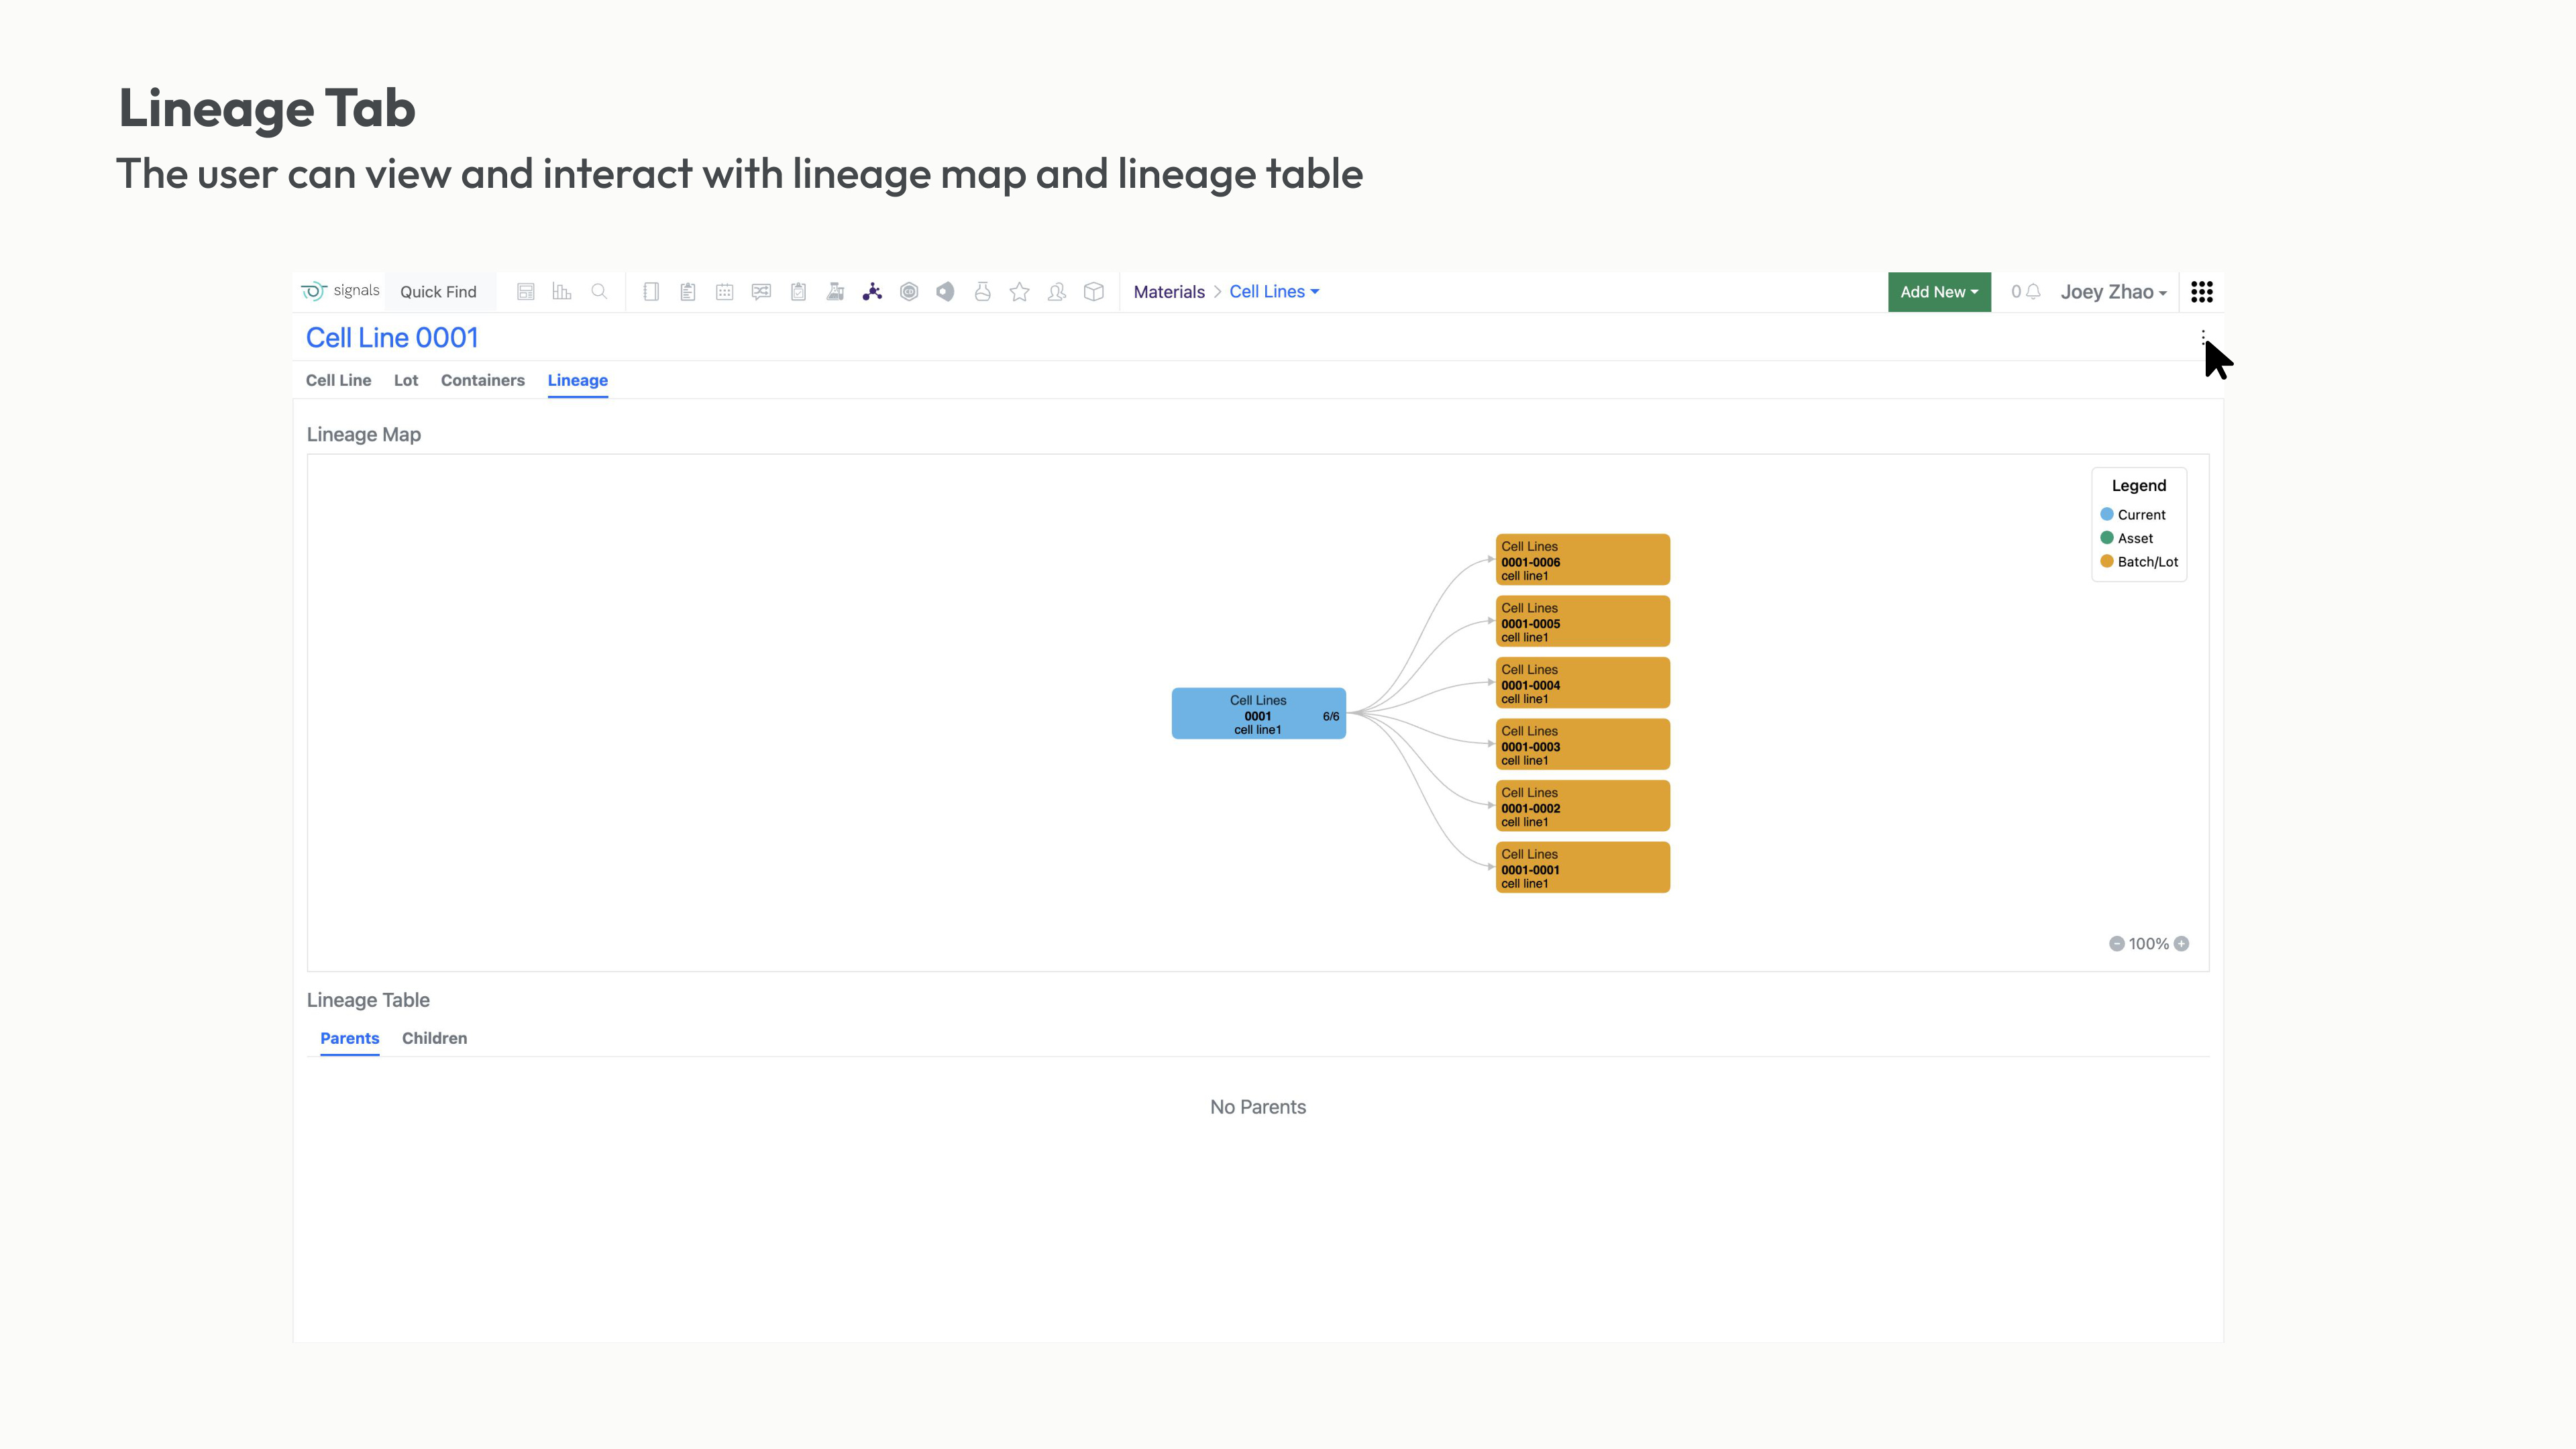
Lineage Tab — interactive lineage map and lineage table view
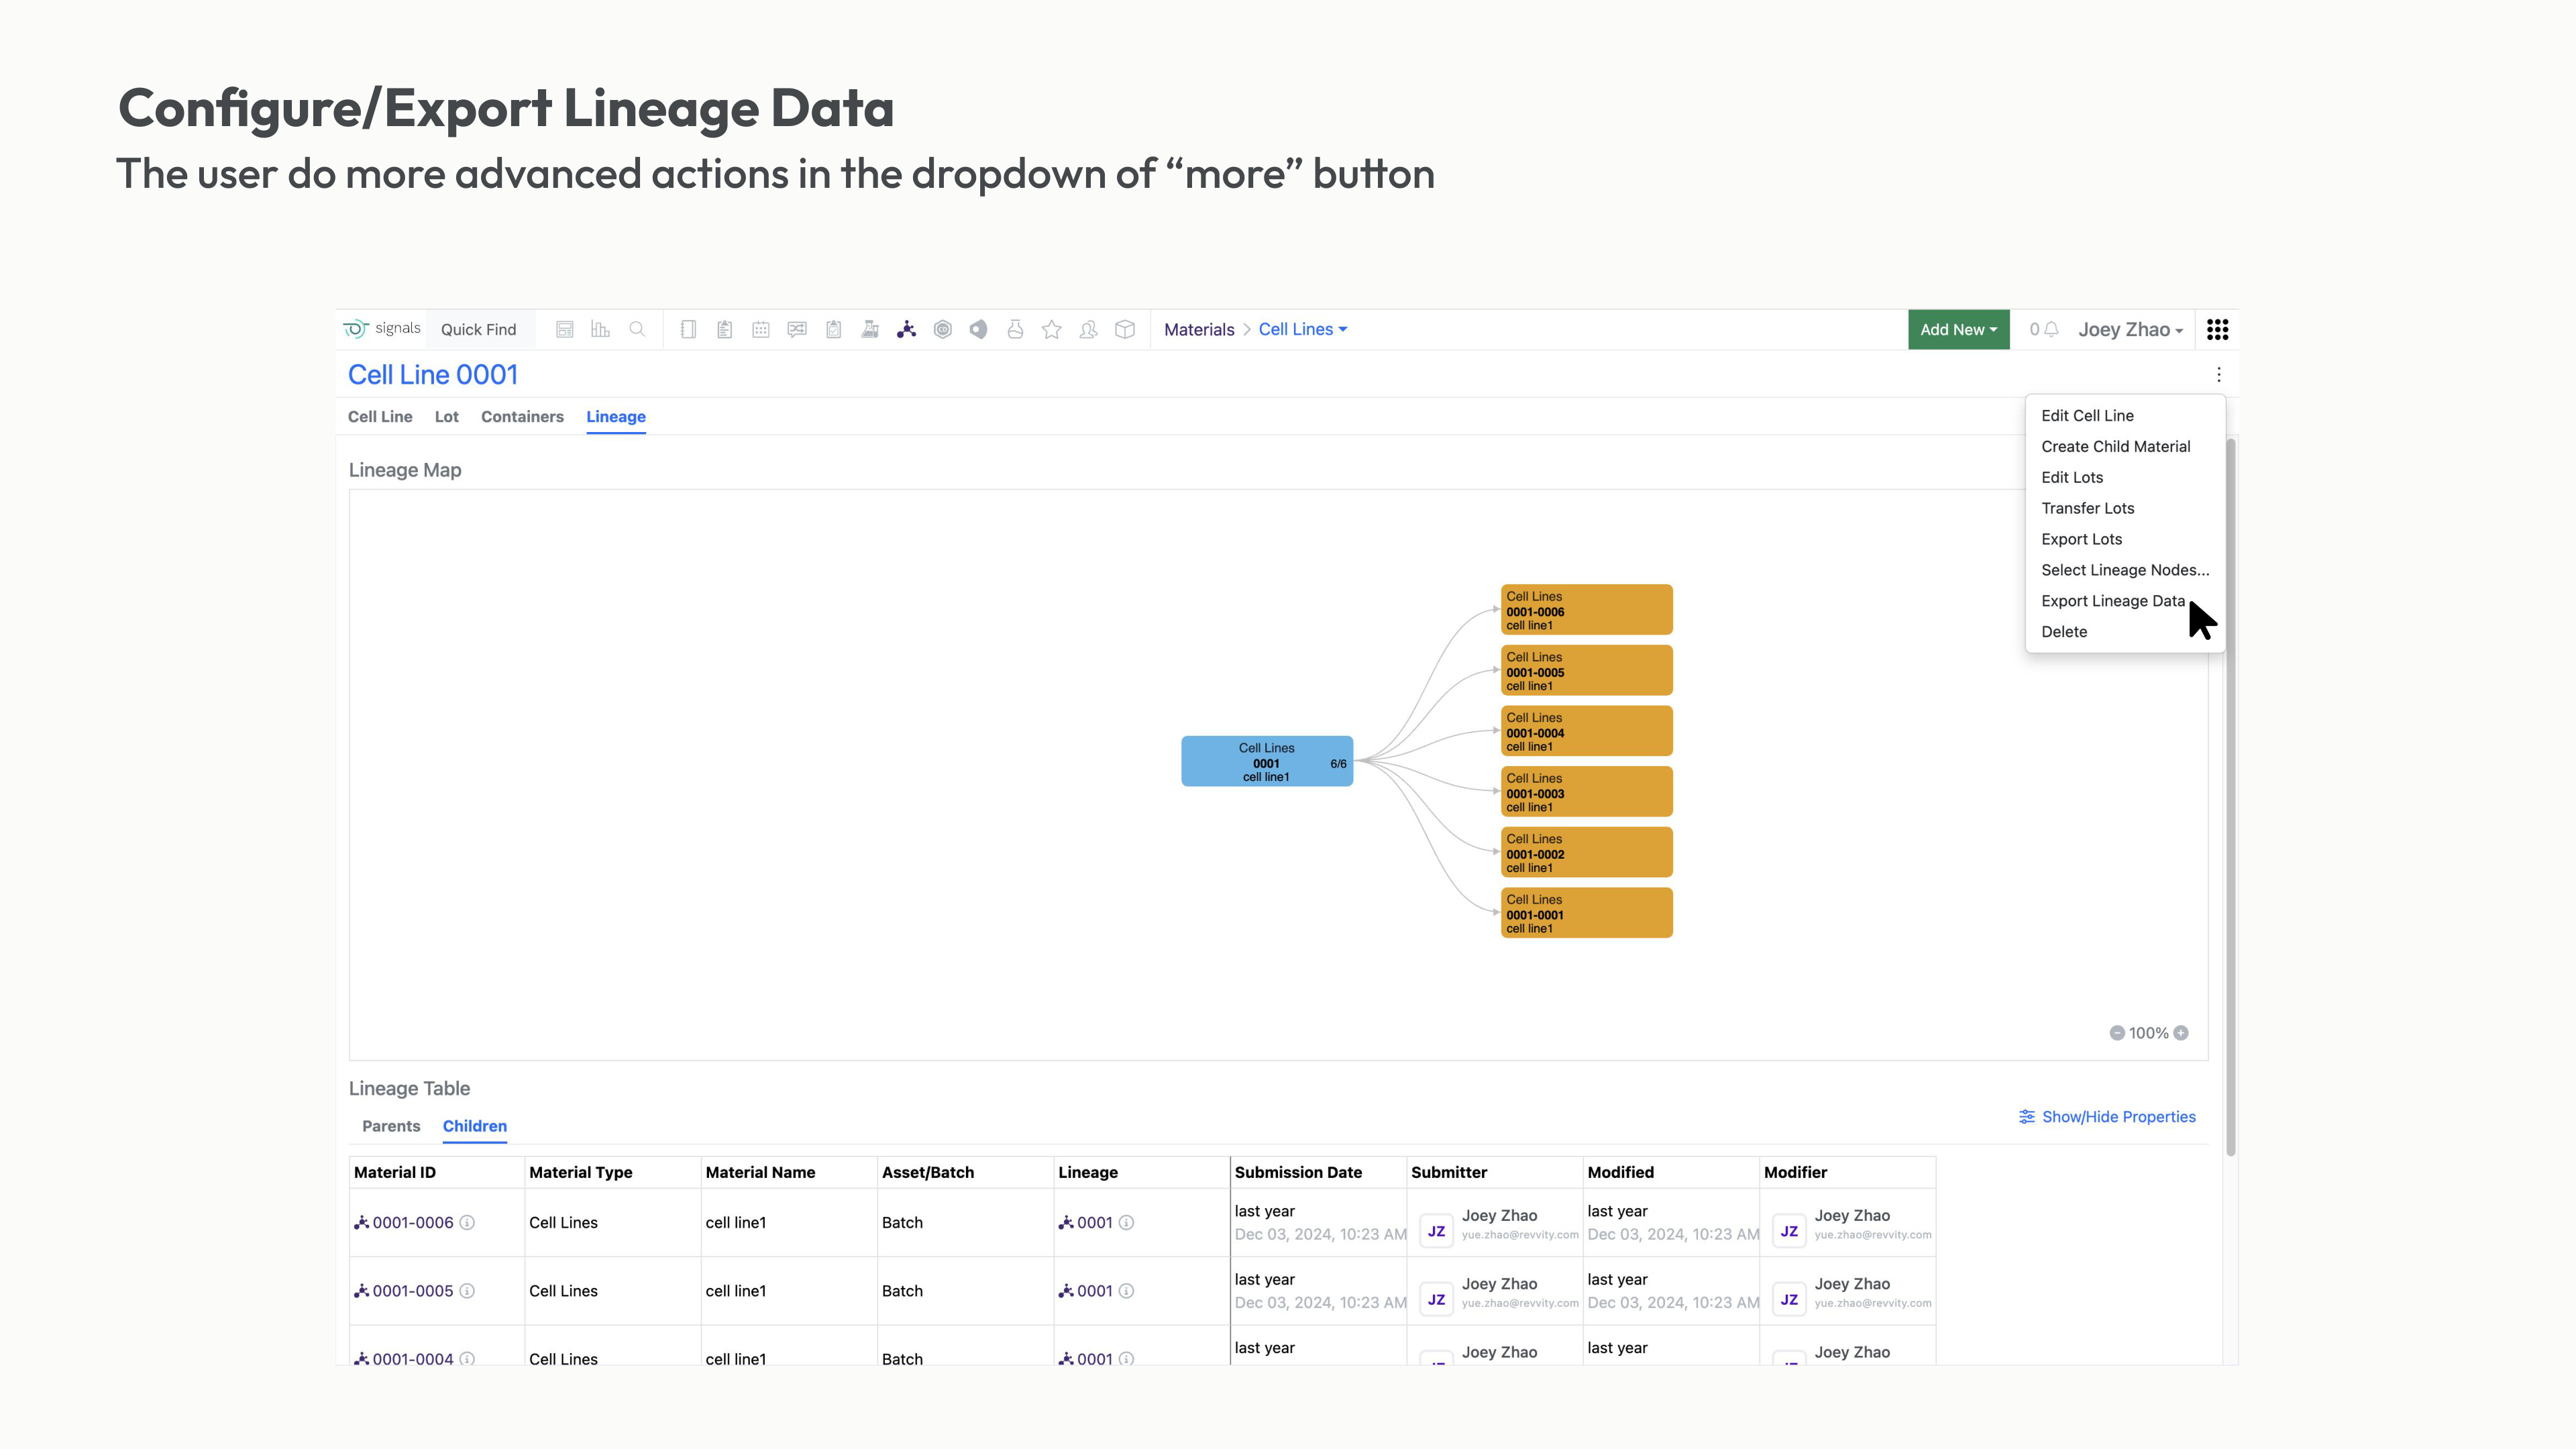
Configure/Export — advanced actions for lineage data management
7Solution: Key Features I Designed
Materials Smart Folder
A unified view of all material types (Cell Lines, Proteins, Antibodies, Viral Vectors) organized in one searchable, filterable interface. Scientists can now find any material in seconds.
Interactive Lineage Map
Visual representation of parent-child relationships with clear distinction between Asset Level (black nodes) and Batch Level (orange nodes). Users can click to expand, collapse, and explore relationships.
Lineage Table View
Tabular alternative for users who prefer data grids. Supports sorting, filtering, and bulk export to Excel/PDF for compliance documentation.
Cross-Product Integration
Seamless integration with Signals Inventa and BioDesign—scientists can trace lineage across experiments, projects, and even different product lines.
💭 What I Learned
Enterprise B2B design is fundamentally different from consumer products. Users can't just switch to a competitor if they don't like your UI—they're locked into multi-year contracts. This means every friction point compounds into hours of lost productivity across thousands of users. The lineage map taught me that visualization isn't about being clever—it's about being invisible. The best compliment we received: "It just shows me what I need to know."