-66%
TASK CHECK谱系追溯,2 小时变 40 分钟(任务测试)
01 / 13 · ORIGIN · 2021-2026
这个页面讲我在 Revvity Signals 的两段工作。2021 到 2023 年,我负责 Signals Notebook 里最难的工作流之一,谱系可视化,让科学家看得见一株细胞系的来历。2026 年,公司把 Signals AI 装进了平台,我负责它的体验设计。两段工作隔着五年,要解决的其实是同一件事,科学家凭什么相信屏幕上的东西。本页所有截图和设计稿都来自真实产品。
查看公开产品页 →02 / BEFORE AI
Signals Notebook 是一本电子实验记录本,全球一万多个科学团队在用。它连着 ChemDraw、Spotfire 和实验室仪器,一年要跑一百万个工作流。Pfizer、Roche、Novartis、Moderna、Merck 的实验记录每天都在上面走。用它的公司签的是多年合同,设计师留下的每一个多余步骤,都会在几千个用户身上,一天一天重复下去。
作为 Sr. Product Designer,我把谱系工作流从访谈一路带到工程交接。这段经历留给我一个问题,在受监管的科学环境里,科学家怎么学会相信一块屏幕。五年之后,这个问题原样摆在了 Signals AI 面前。
MY RESPONSIBILITIES
谱系工作流端到端设计,研究综合、信息架构、线框图、原型、可用性测试、工程交接,以及和 PM、工程把范围谈拢
TEAM
我(Sr. Product Designer)+ 1 名产品经理 + 10 名开发工程师
TIMELINE
约 5 个月核心设计,2021 年起随产品持续迭代
TOOLS
Figma · Jira · Confluence · Miro
-66%
TASK CHECK谱系追溯,2 小时变 40 分钟(任务测试)
+20%
NPS25 到 30,发布后脉搏调研
$100M+
ANNUAL REVENUE所在产品线的年收入量级
1M+
WORKFLOWS每年在平台上运行的工作流
测量边界。-66% 和 NPS 来自任务测试与发布后调研,量的是谱系追溯这个工作流本身,不能说成设计单独改变了产品的全部表现。NPS 和营收描述的是发布后产品的整体状态。设计贡献最清楚的地方,是发现、定位、导出需要的步骤变少了。
03 / THE CHALLENGE
这是我在头部药企做用户访谈时,听到最多的抱怨。拆开看,是四个老问题。
PAIN 01
谱系数据散落在不同实验、工具与格式里,拼出一段完整的历史既费时又容易出错。
PAIN 02
生物材料(细胞系、蛋白质、抗体、病毒载体)有多层的父子关系,现有工具没法画清楚。
PAIN 03
研究体量一大,系统在大型数据集和实时协作上就开始吃力。
PAIN 04
当时的可视化工具是给数据科学家做的,急着要答案的是一线科学家。
04 / THE LANDSCAPE
✓ 为模式生物提供简单、可交互的谱系追踪
✗ 撑不住复杂的生物制剂工作流
✓ 数据集成灵活,谱系表格做得不错
✗ 实时协作和大数据集上表现弱
✓ 细胞系谱系和合规能力扎实
✗ 界面对非技术用户太复杂
05 / THE DECISION
竞品全都默认表格视图。访谈里科学家是用关系想问题的,我就用地图当主视图、表格做辅助,照着他们真实的建模方式来。任务测试里,追溯时间缩到原来的三分之一多一点,用户不用再在脑子里把扁平数据拼成层级。设计贡献最明显的,是发现、定位、导出这三个环节。
推动落地。难的地方在让 PM 和工程相信,地图优先这件事进得了一个合规至上的企业产品。我把提案从视觉实验改写成低风险的工作流变更,智能文件夹留着做发现,图谱放进独立的 Lineage 标签页,表格和导出留给审计,不逼任何人改信息架构。PM 拿到了干净的边界,工程拿到了一条能做的路径。
纯表格方案构建风险更低,但核心的认知负担还在,科学家仍要自己动手重建父子关系。
大型材料图谱可能又乱又贵,所以用渐进式探索,不一次把所有关系都摊开。
跨产品谱系留作方向,v1 先做 Materials 智能文件夹、Lineage 标签页、表格支撑和导出。
06 / THE WORKFLOW
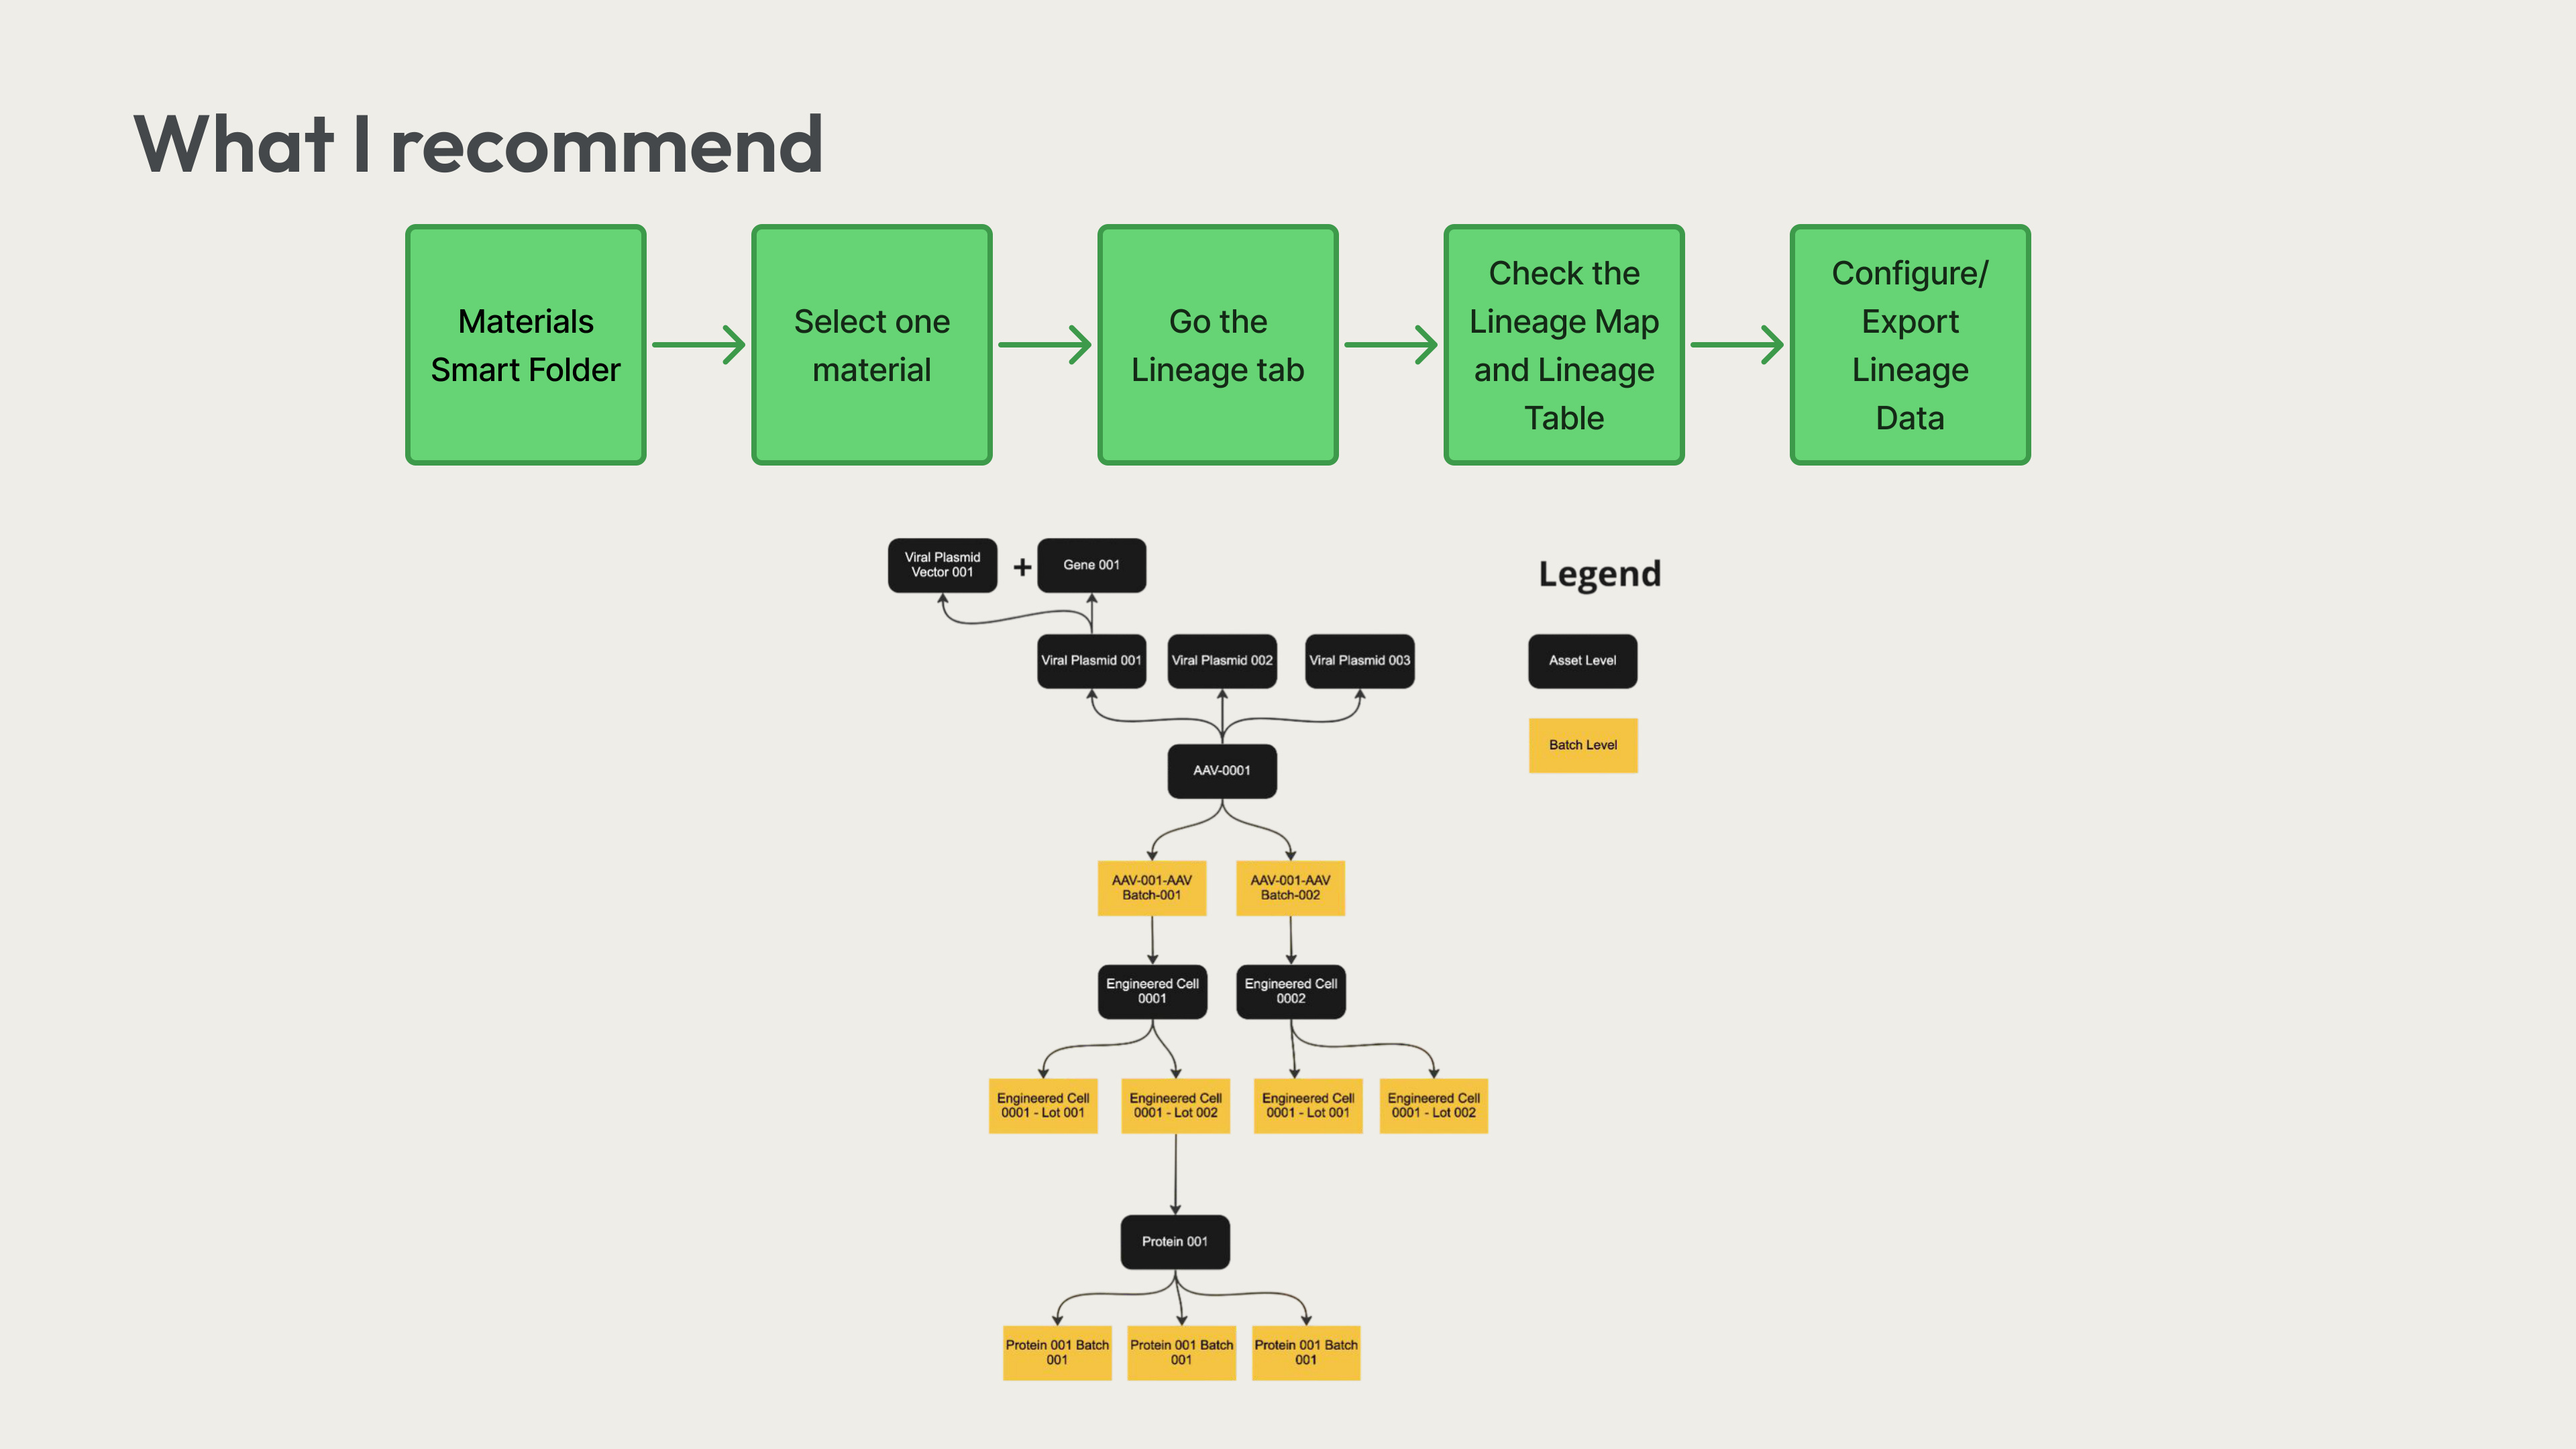
我把整个工作流重新走了一遍,让追溯从按小时计变成按分钟计。
1
Materials 智能文件夹
2
选择材料
3
进入 Lineage 标签页
4
查看地图与表格
5
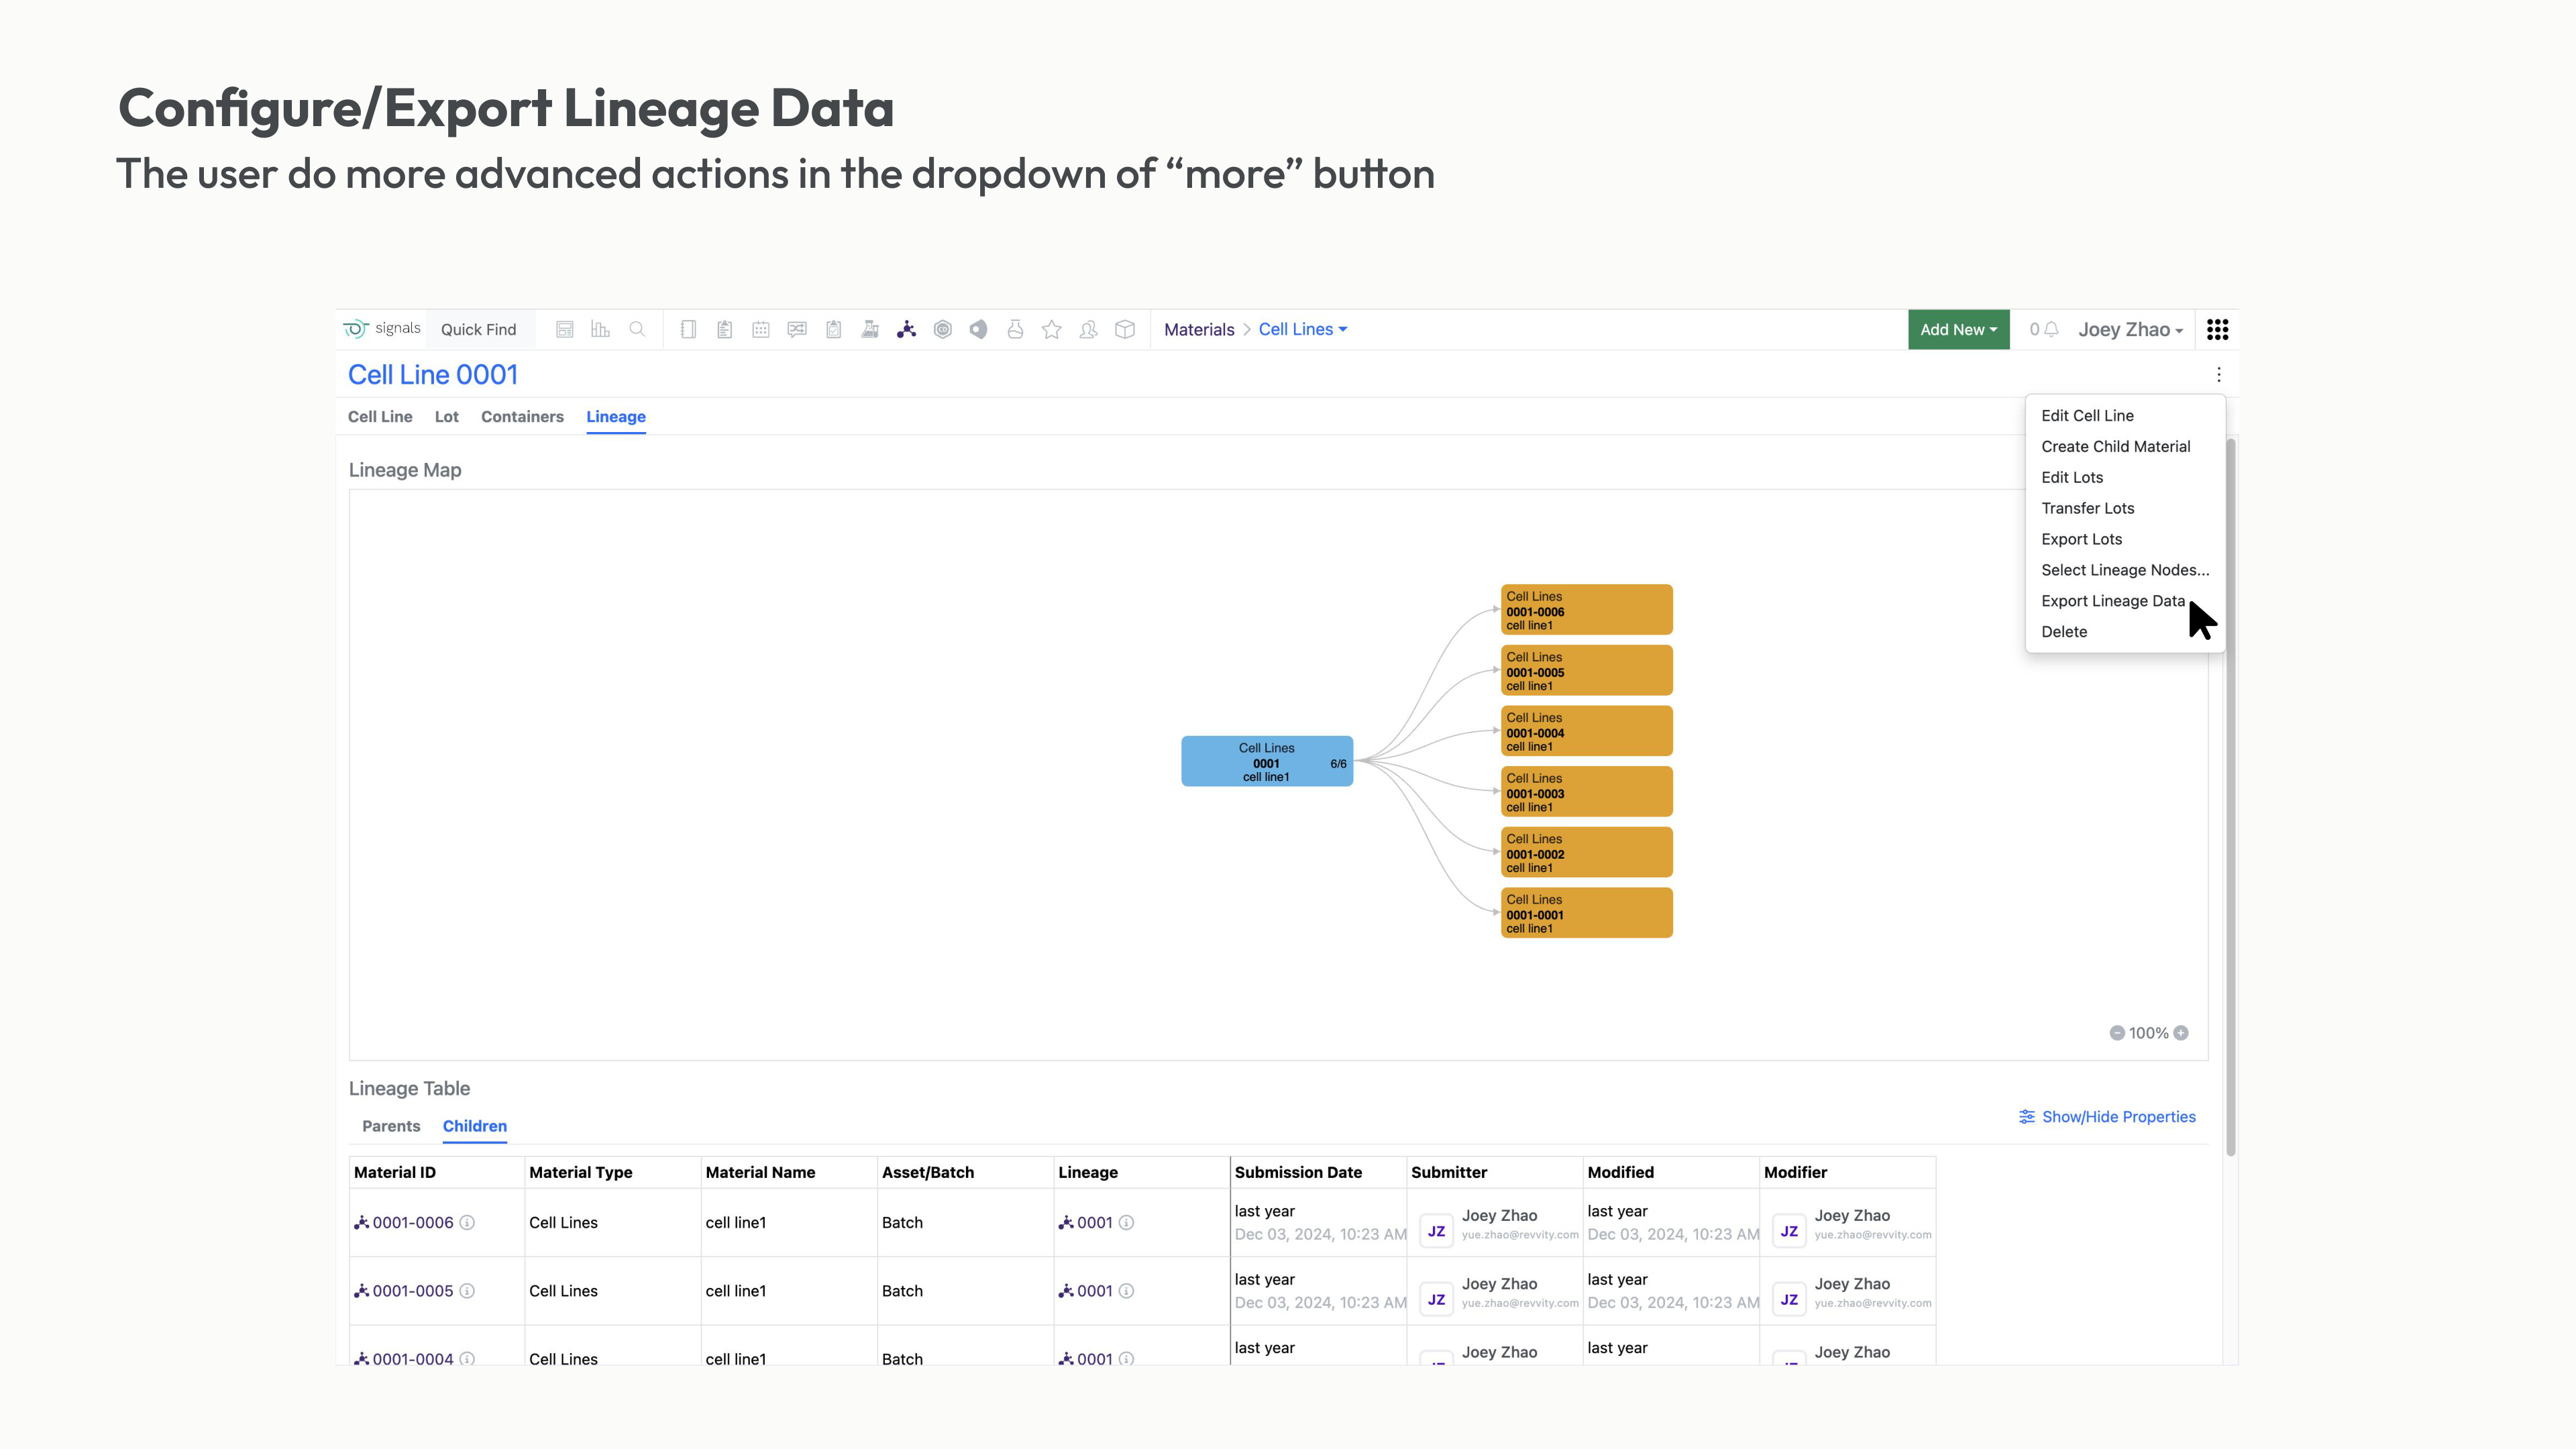
配置与导出
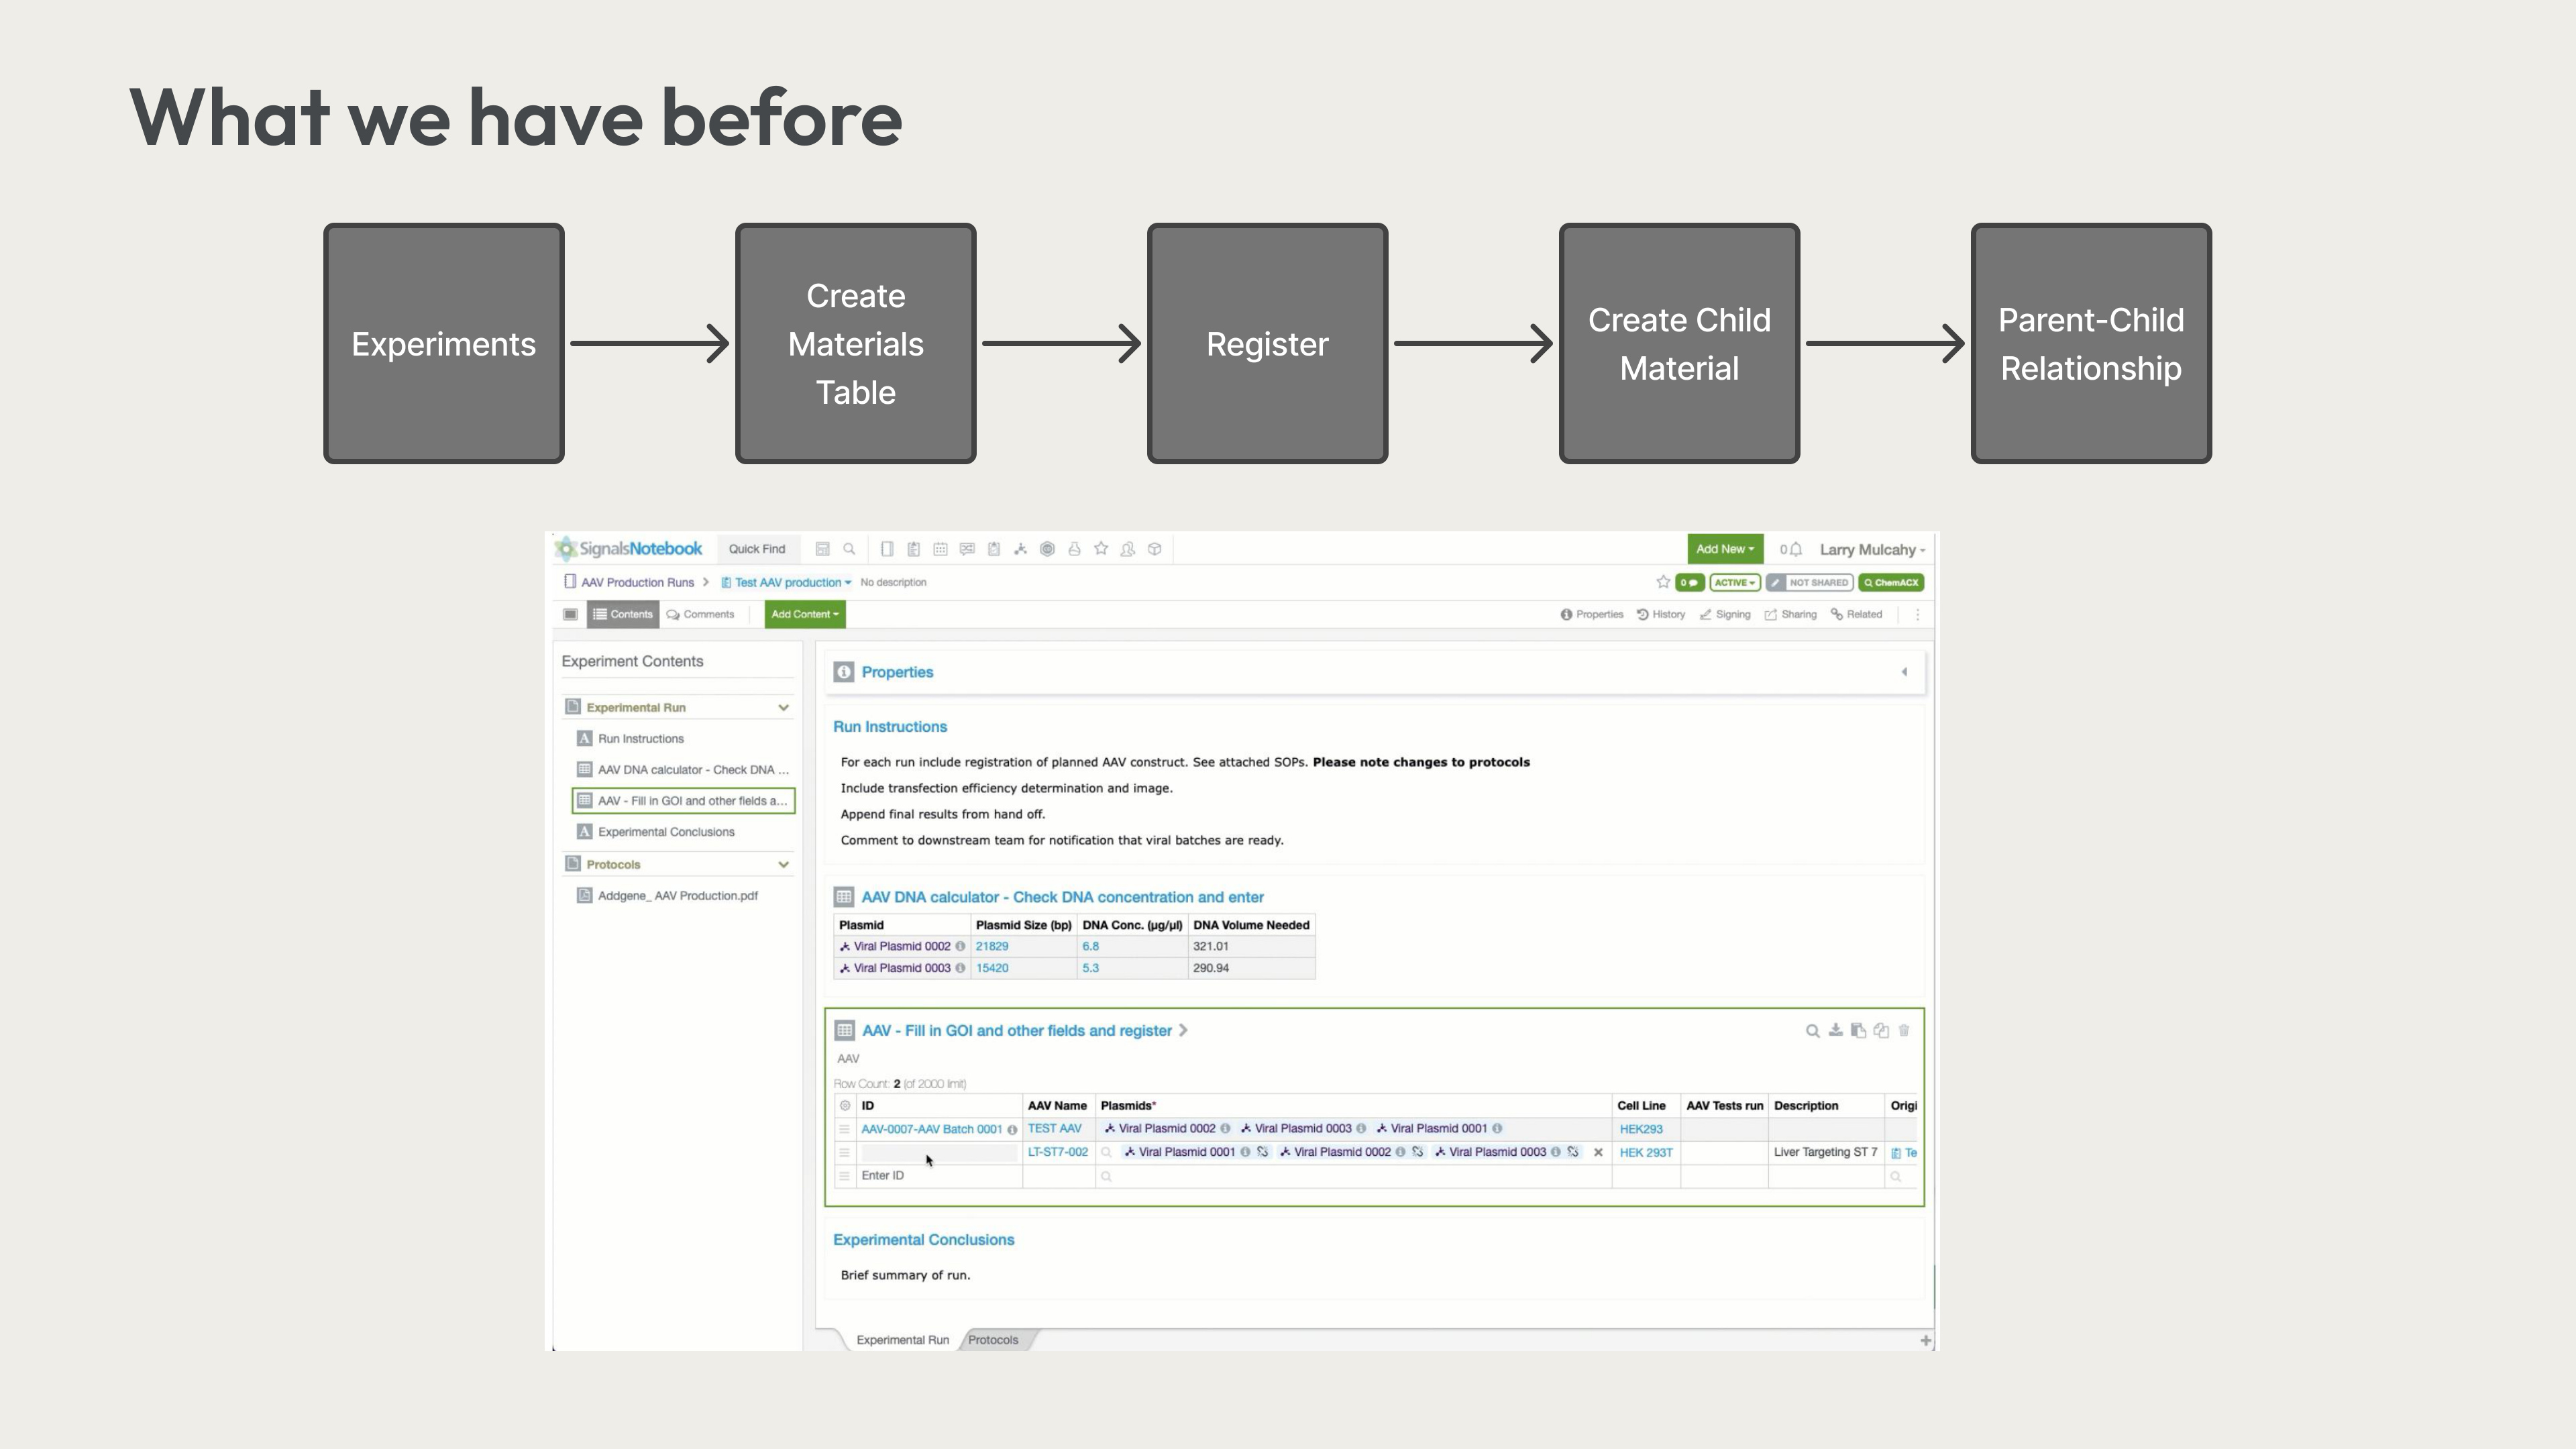
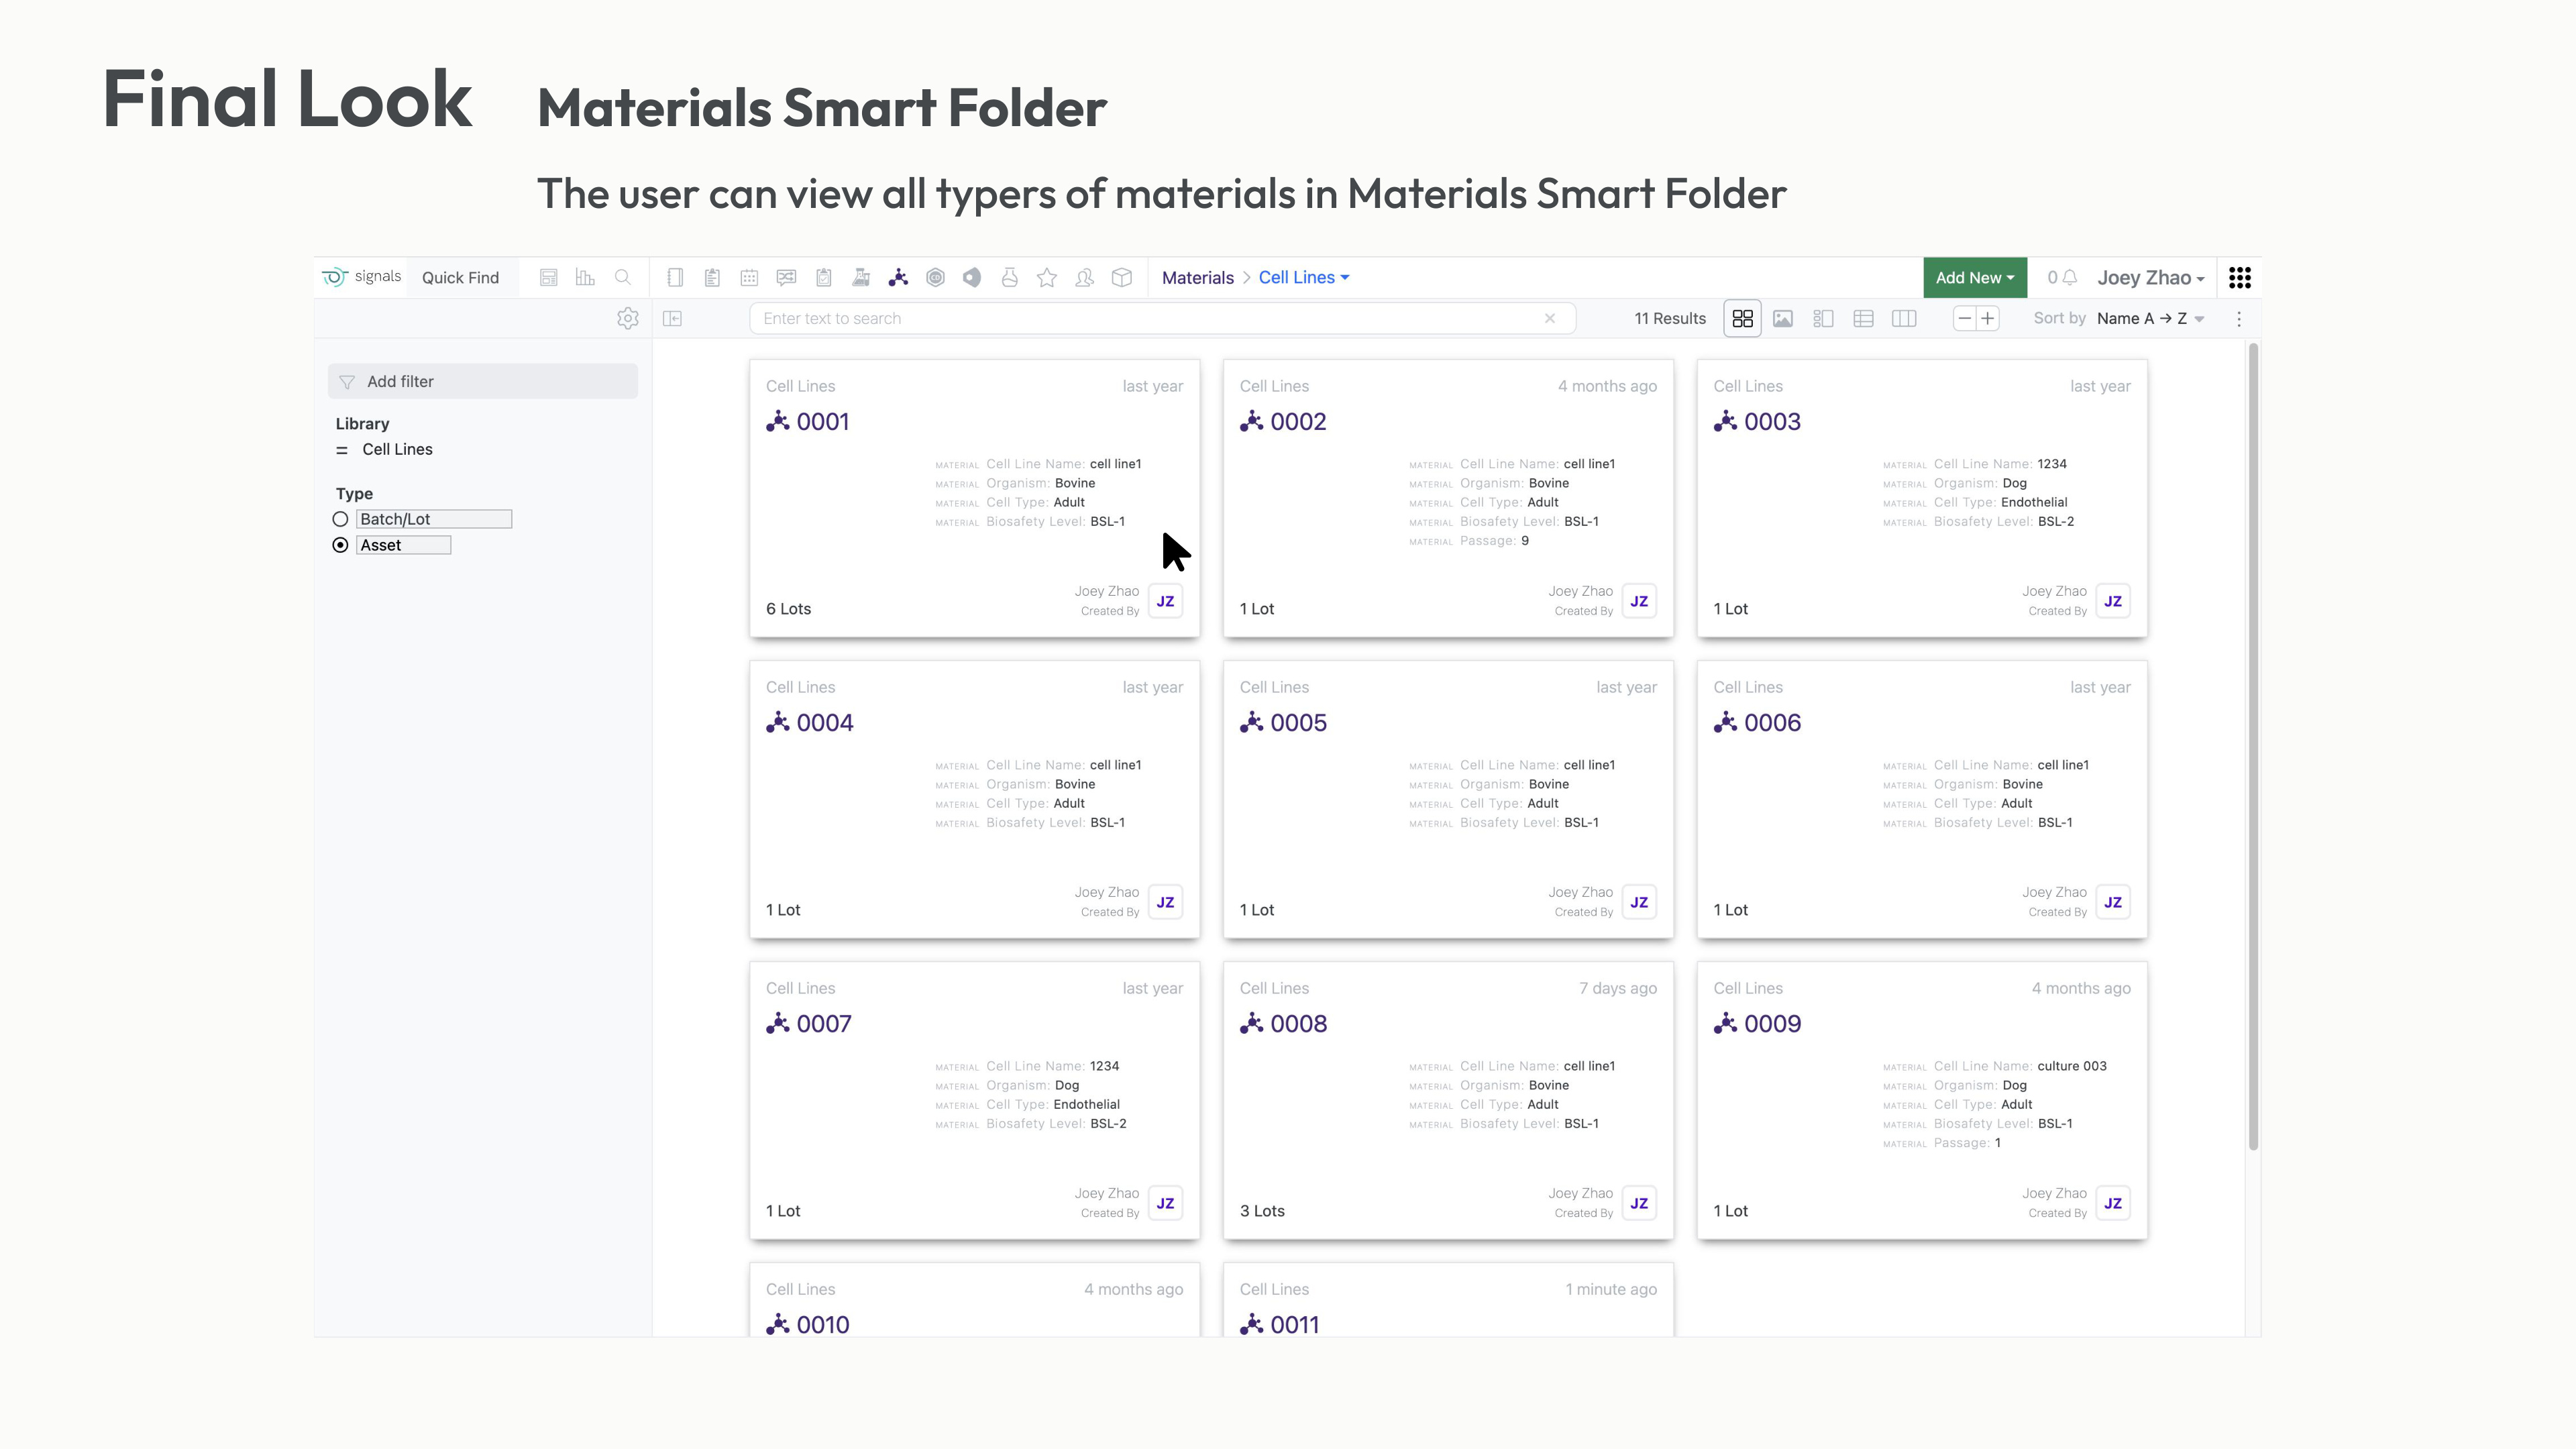
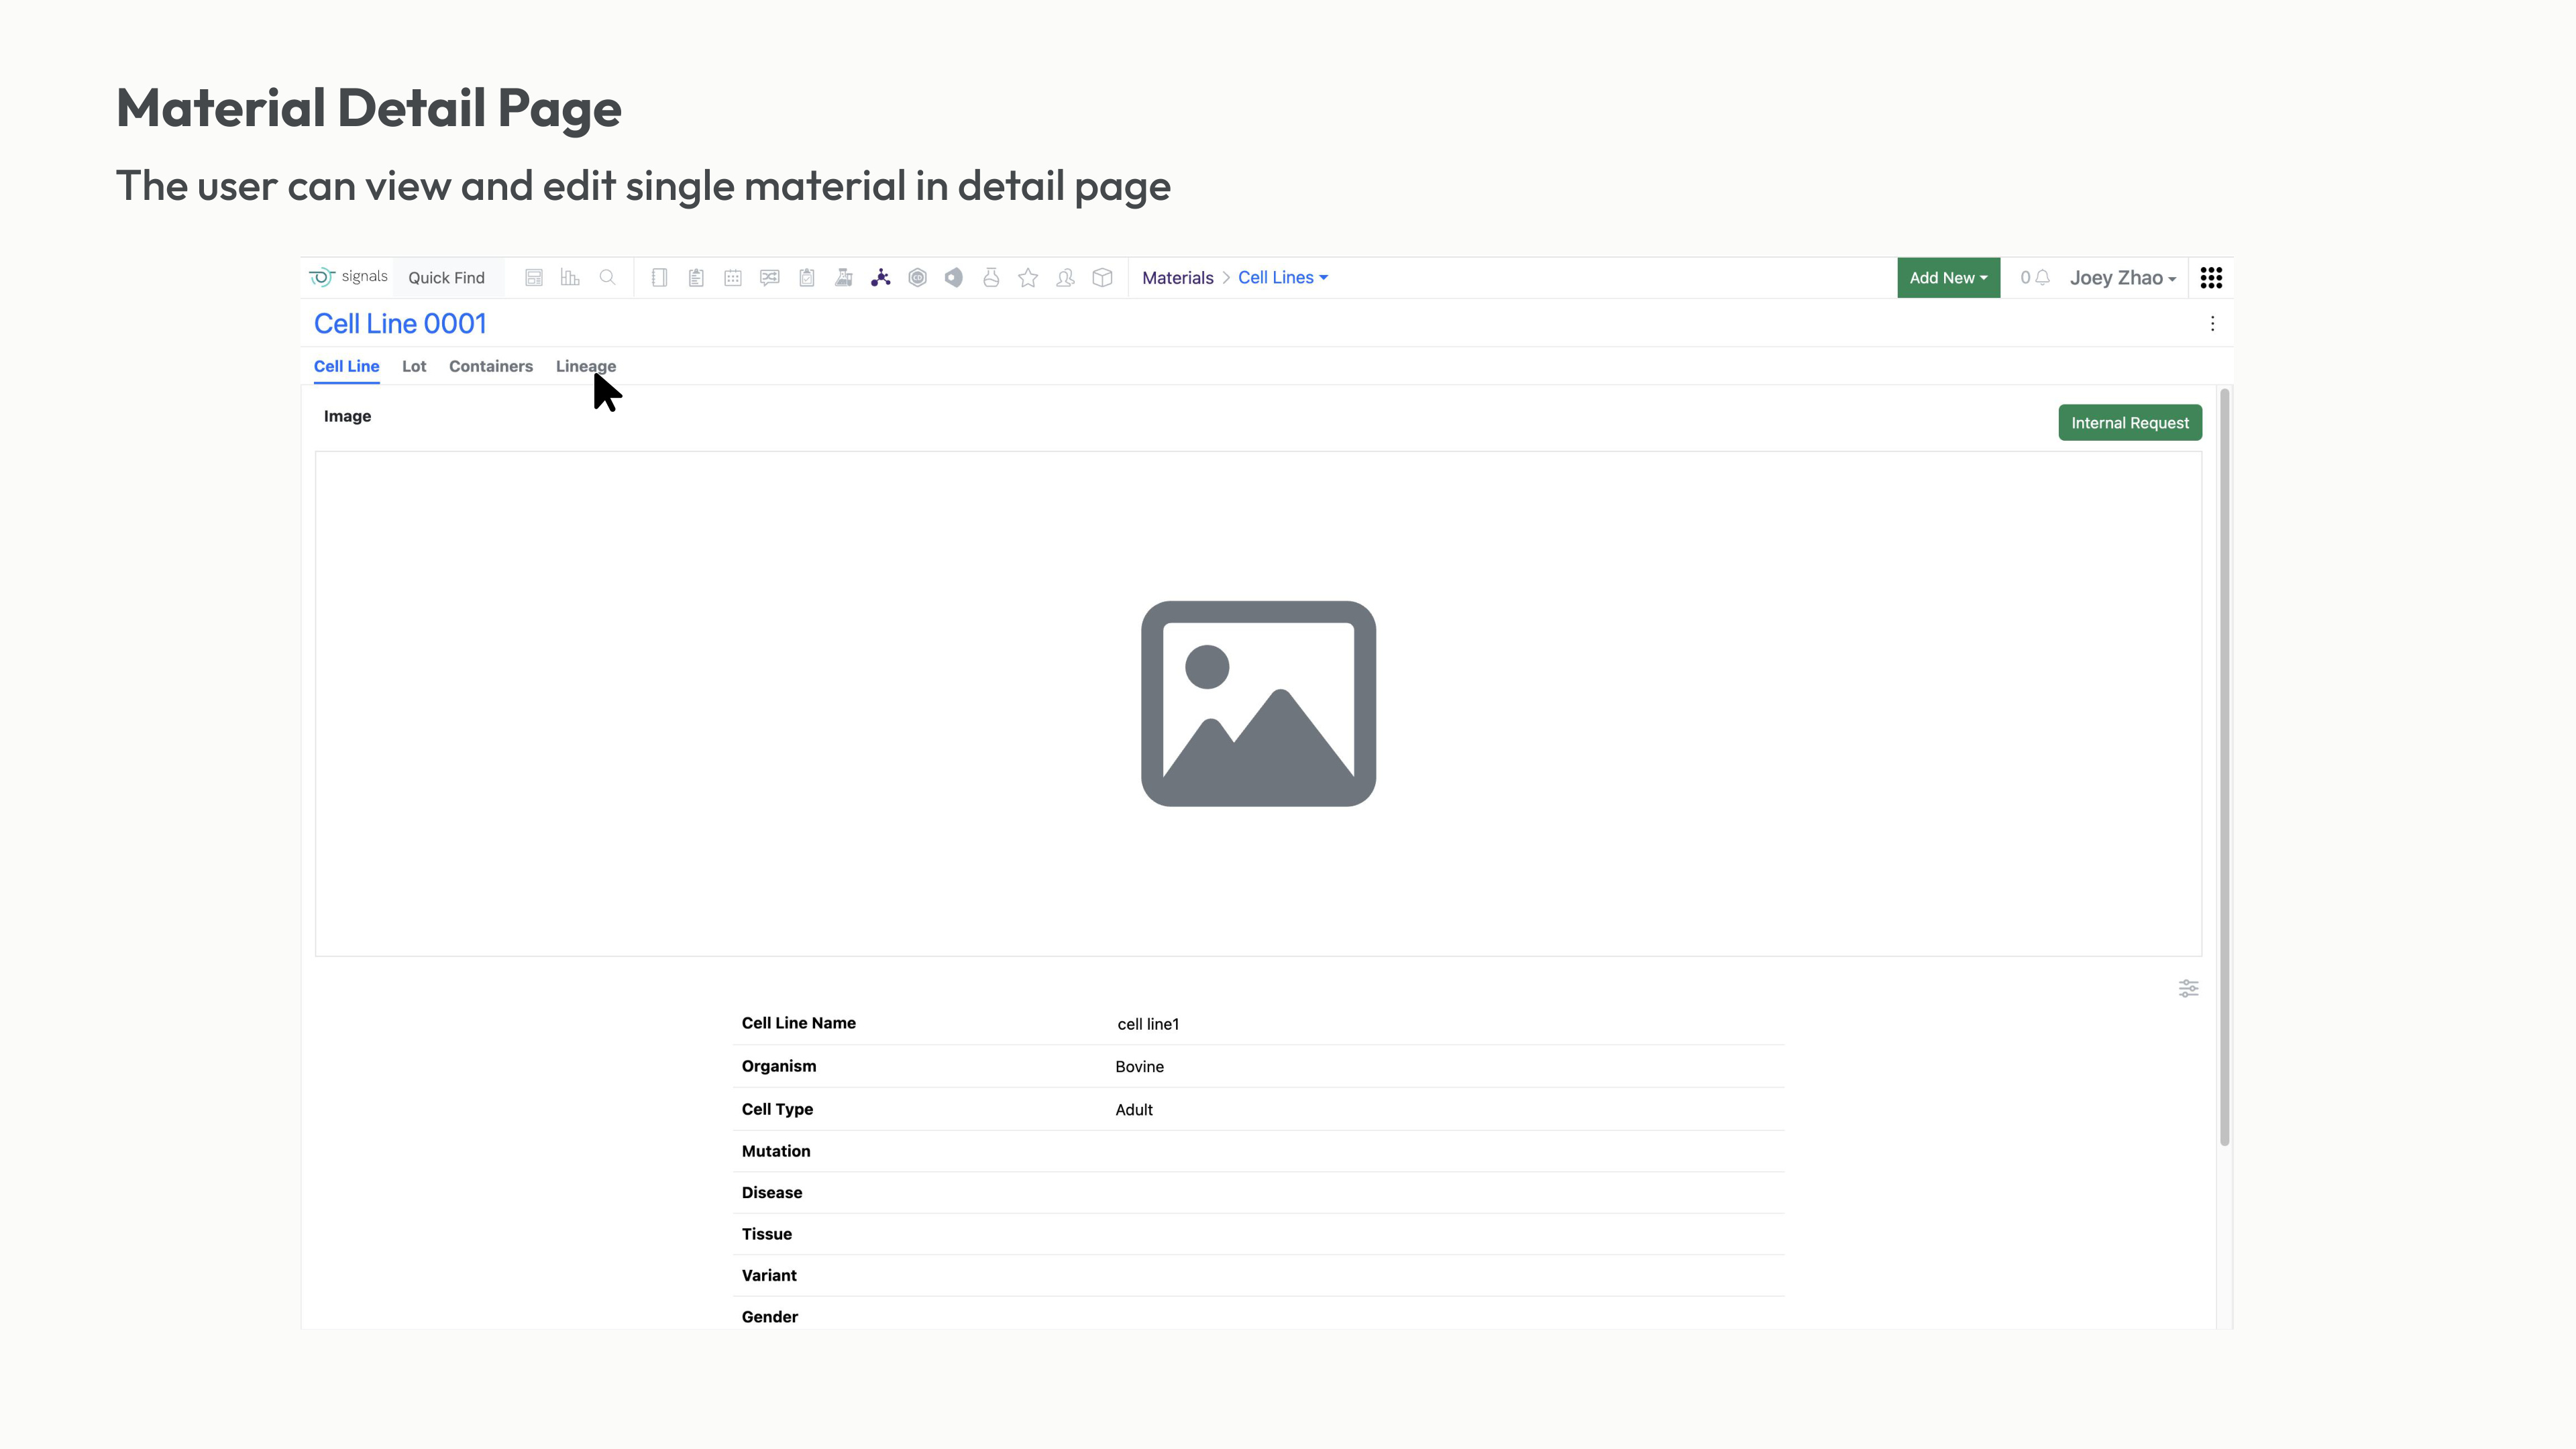
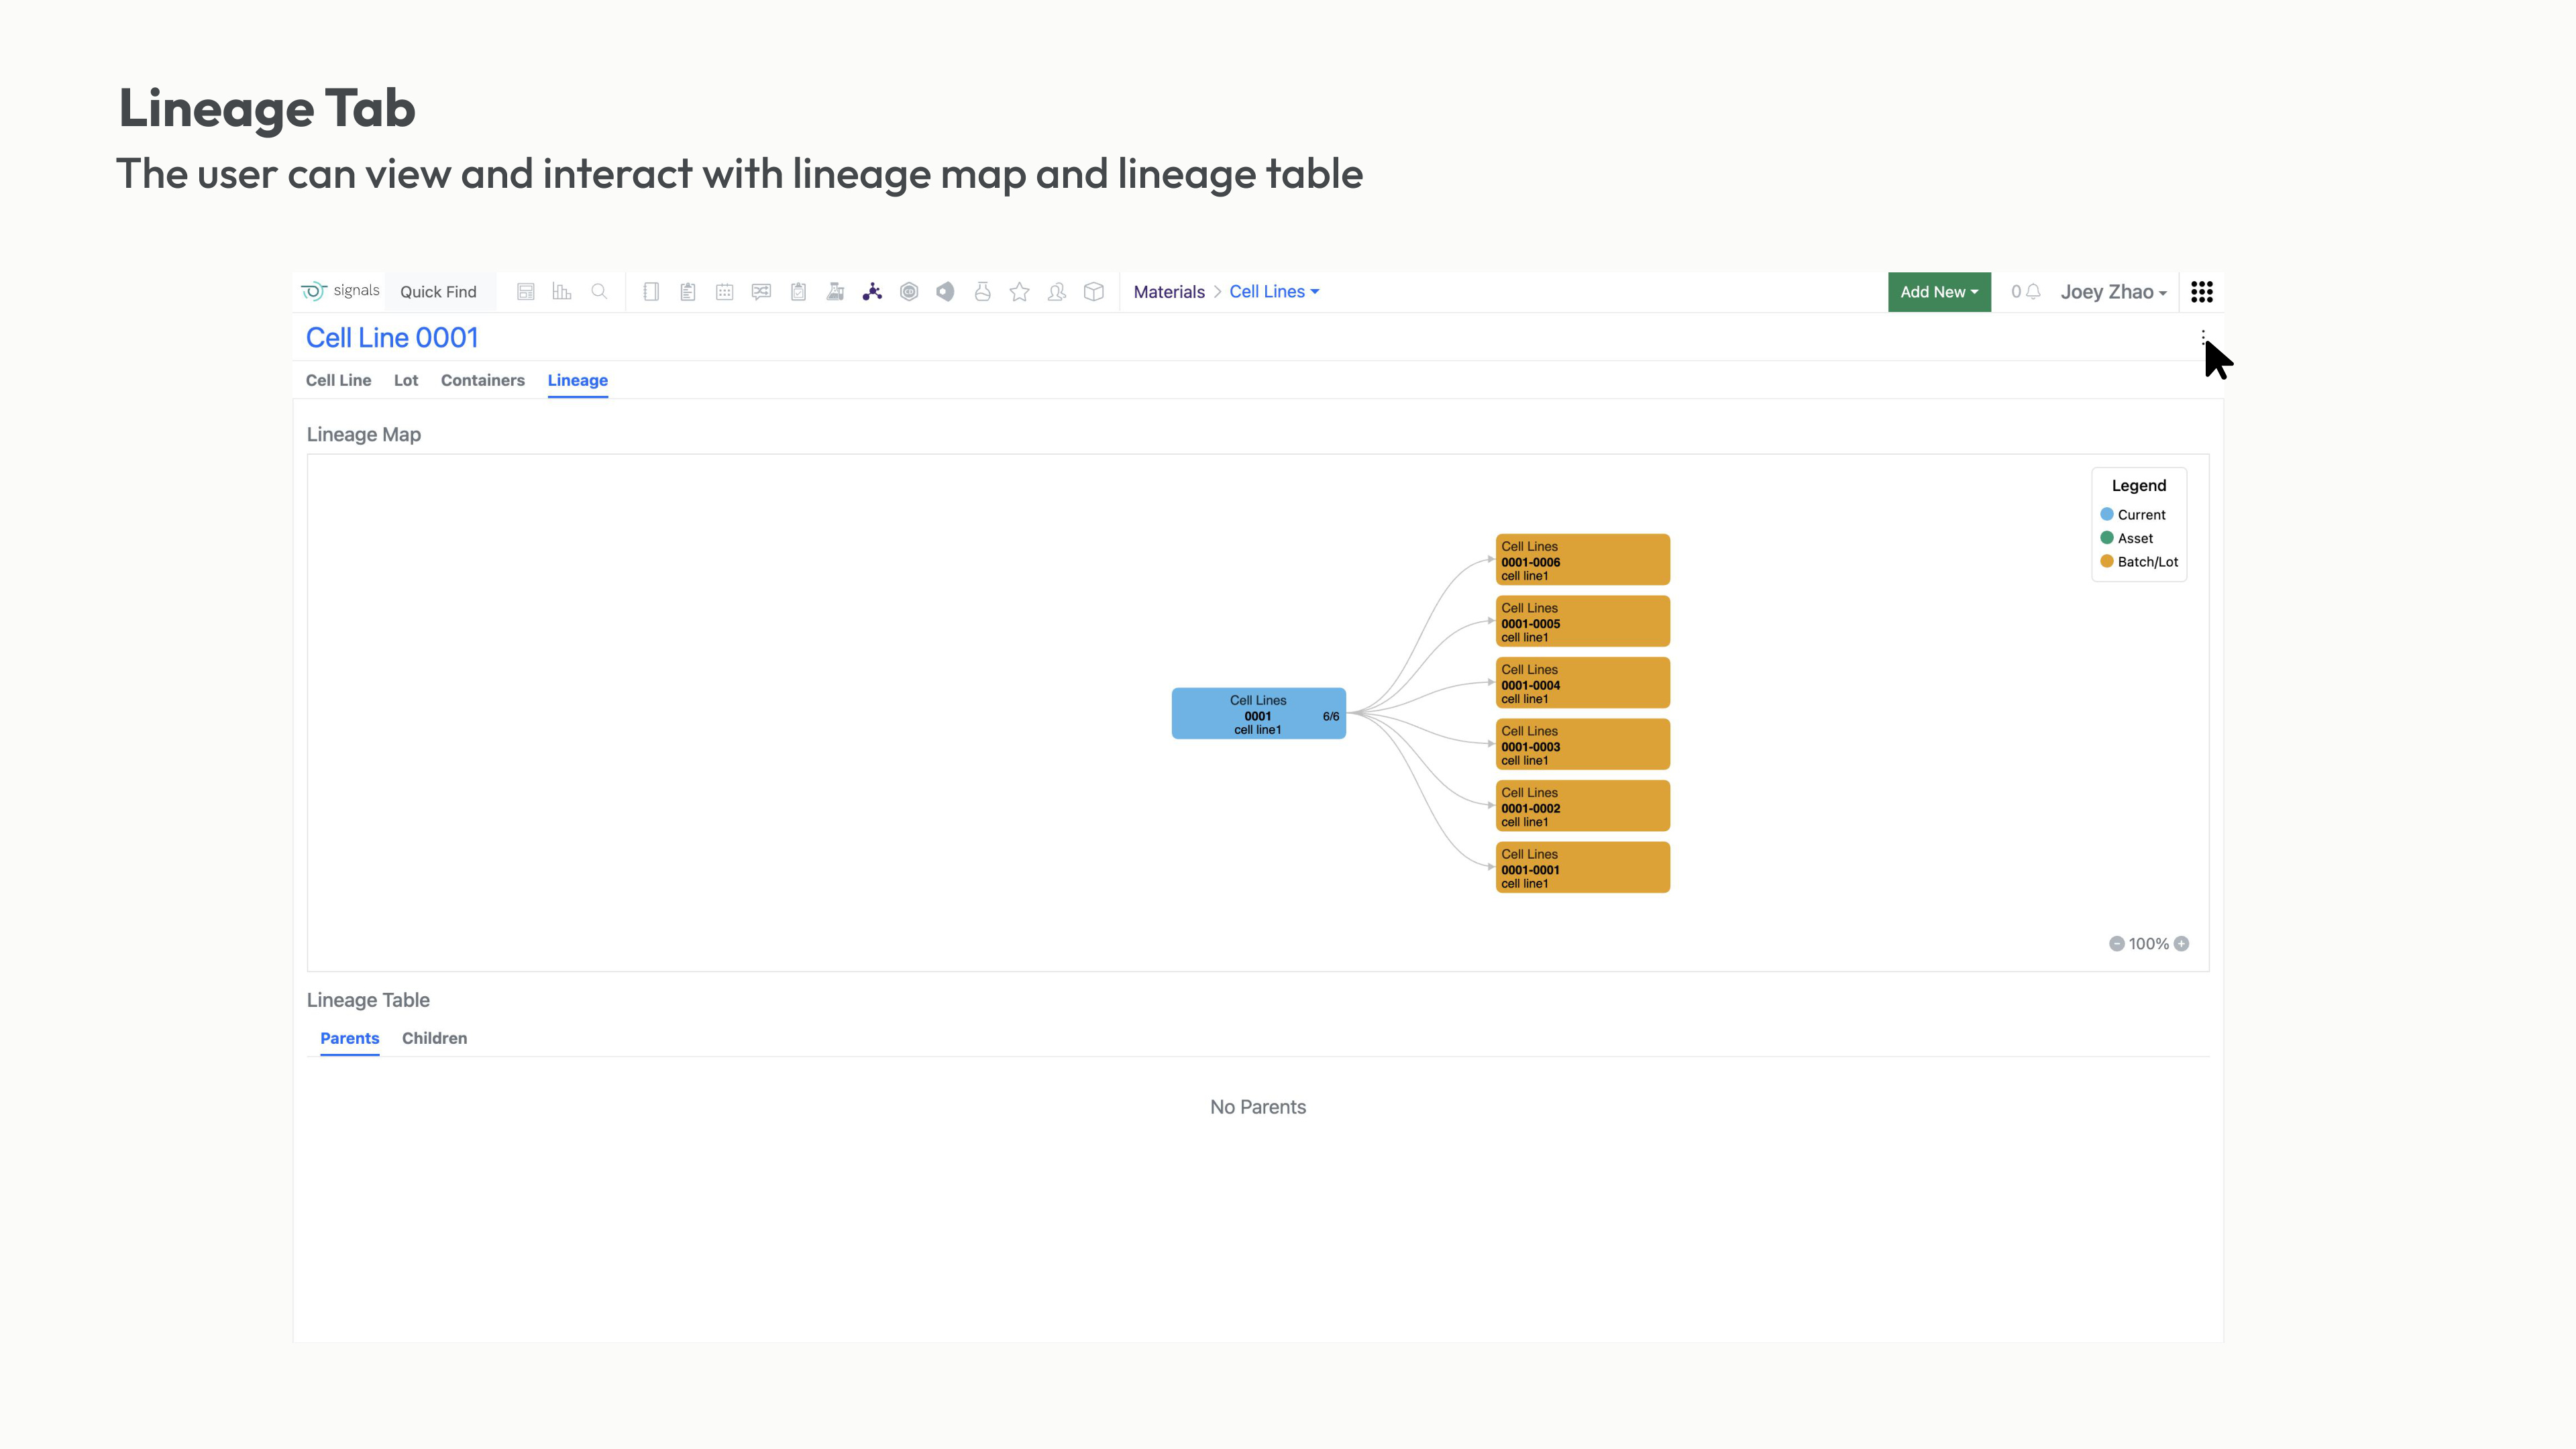
所有材料类型(细胞系、蛋白质、抗体、病毒载体)放进同一个可搜索、可筛选的界面。现在找任何材料都是几秒钟的事。
父子关系直接画出来,黑色节点是材料资产,橙色节点是批次。点一下就能展开、折叠、往下探。
给喜欢数据网格的人保留表格,支持排序、筛选,也能批量导出 Excel/PDF 做合规文档。
和 Signals Inventa、BioDesign 打通,跨实验、跨项目、跨产品线都能追谱系。
这是用户给过我们最好的一句评价。企业软件的用户走不掉,合同一签多年,不喜欢也只能接着用,所以每一个多余的步骤,都会在几千个人身上天天重复。谱系地图教会我的是,可视化不用显得聪明,等用户注意不到它的时候,它就成了。
07 / THE SHIFT
谱系项目回答的是材料从哪来。五年后 Signals AI 要回答一个更大的问题,我的数据能告诉我什么。2026 年 6 月 22 日,它作为 Signals One 平台的原生智能体框架公开发布,官方的说法是「把科学软件从记录系统变成理解系统」。当时摆在设计面前的还是两条老路,两条都没走。
上市最快。但科学家得离开实验记录、切到新窗口去提问,回答跟数据脱了钩,没人敢把这样的结论写回受监管的实验记录。
稳妥,但走的还是老路。Revvity Signals 总裁 Kevin Willoe 是这么形容旧世界的,「几十年来,科学软件把信息锁进预定义的应用、工作流和仪表盘。」
Signals AI 做成了 Signals One 的一层原生智能。它停在科学家已经在用的界面里,回答落在本体论和结构化的实验数据上,能溯源,也能直接执行。代价是信任得做进信息架构里,免责声明救不了场。
08 / TRUST
药企的研发受监管,一个编出来的回答可能让一条实验线白做。所以我把「能相信」这件事,拆成了界面里四件看得见的东西。
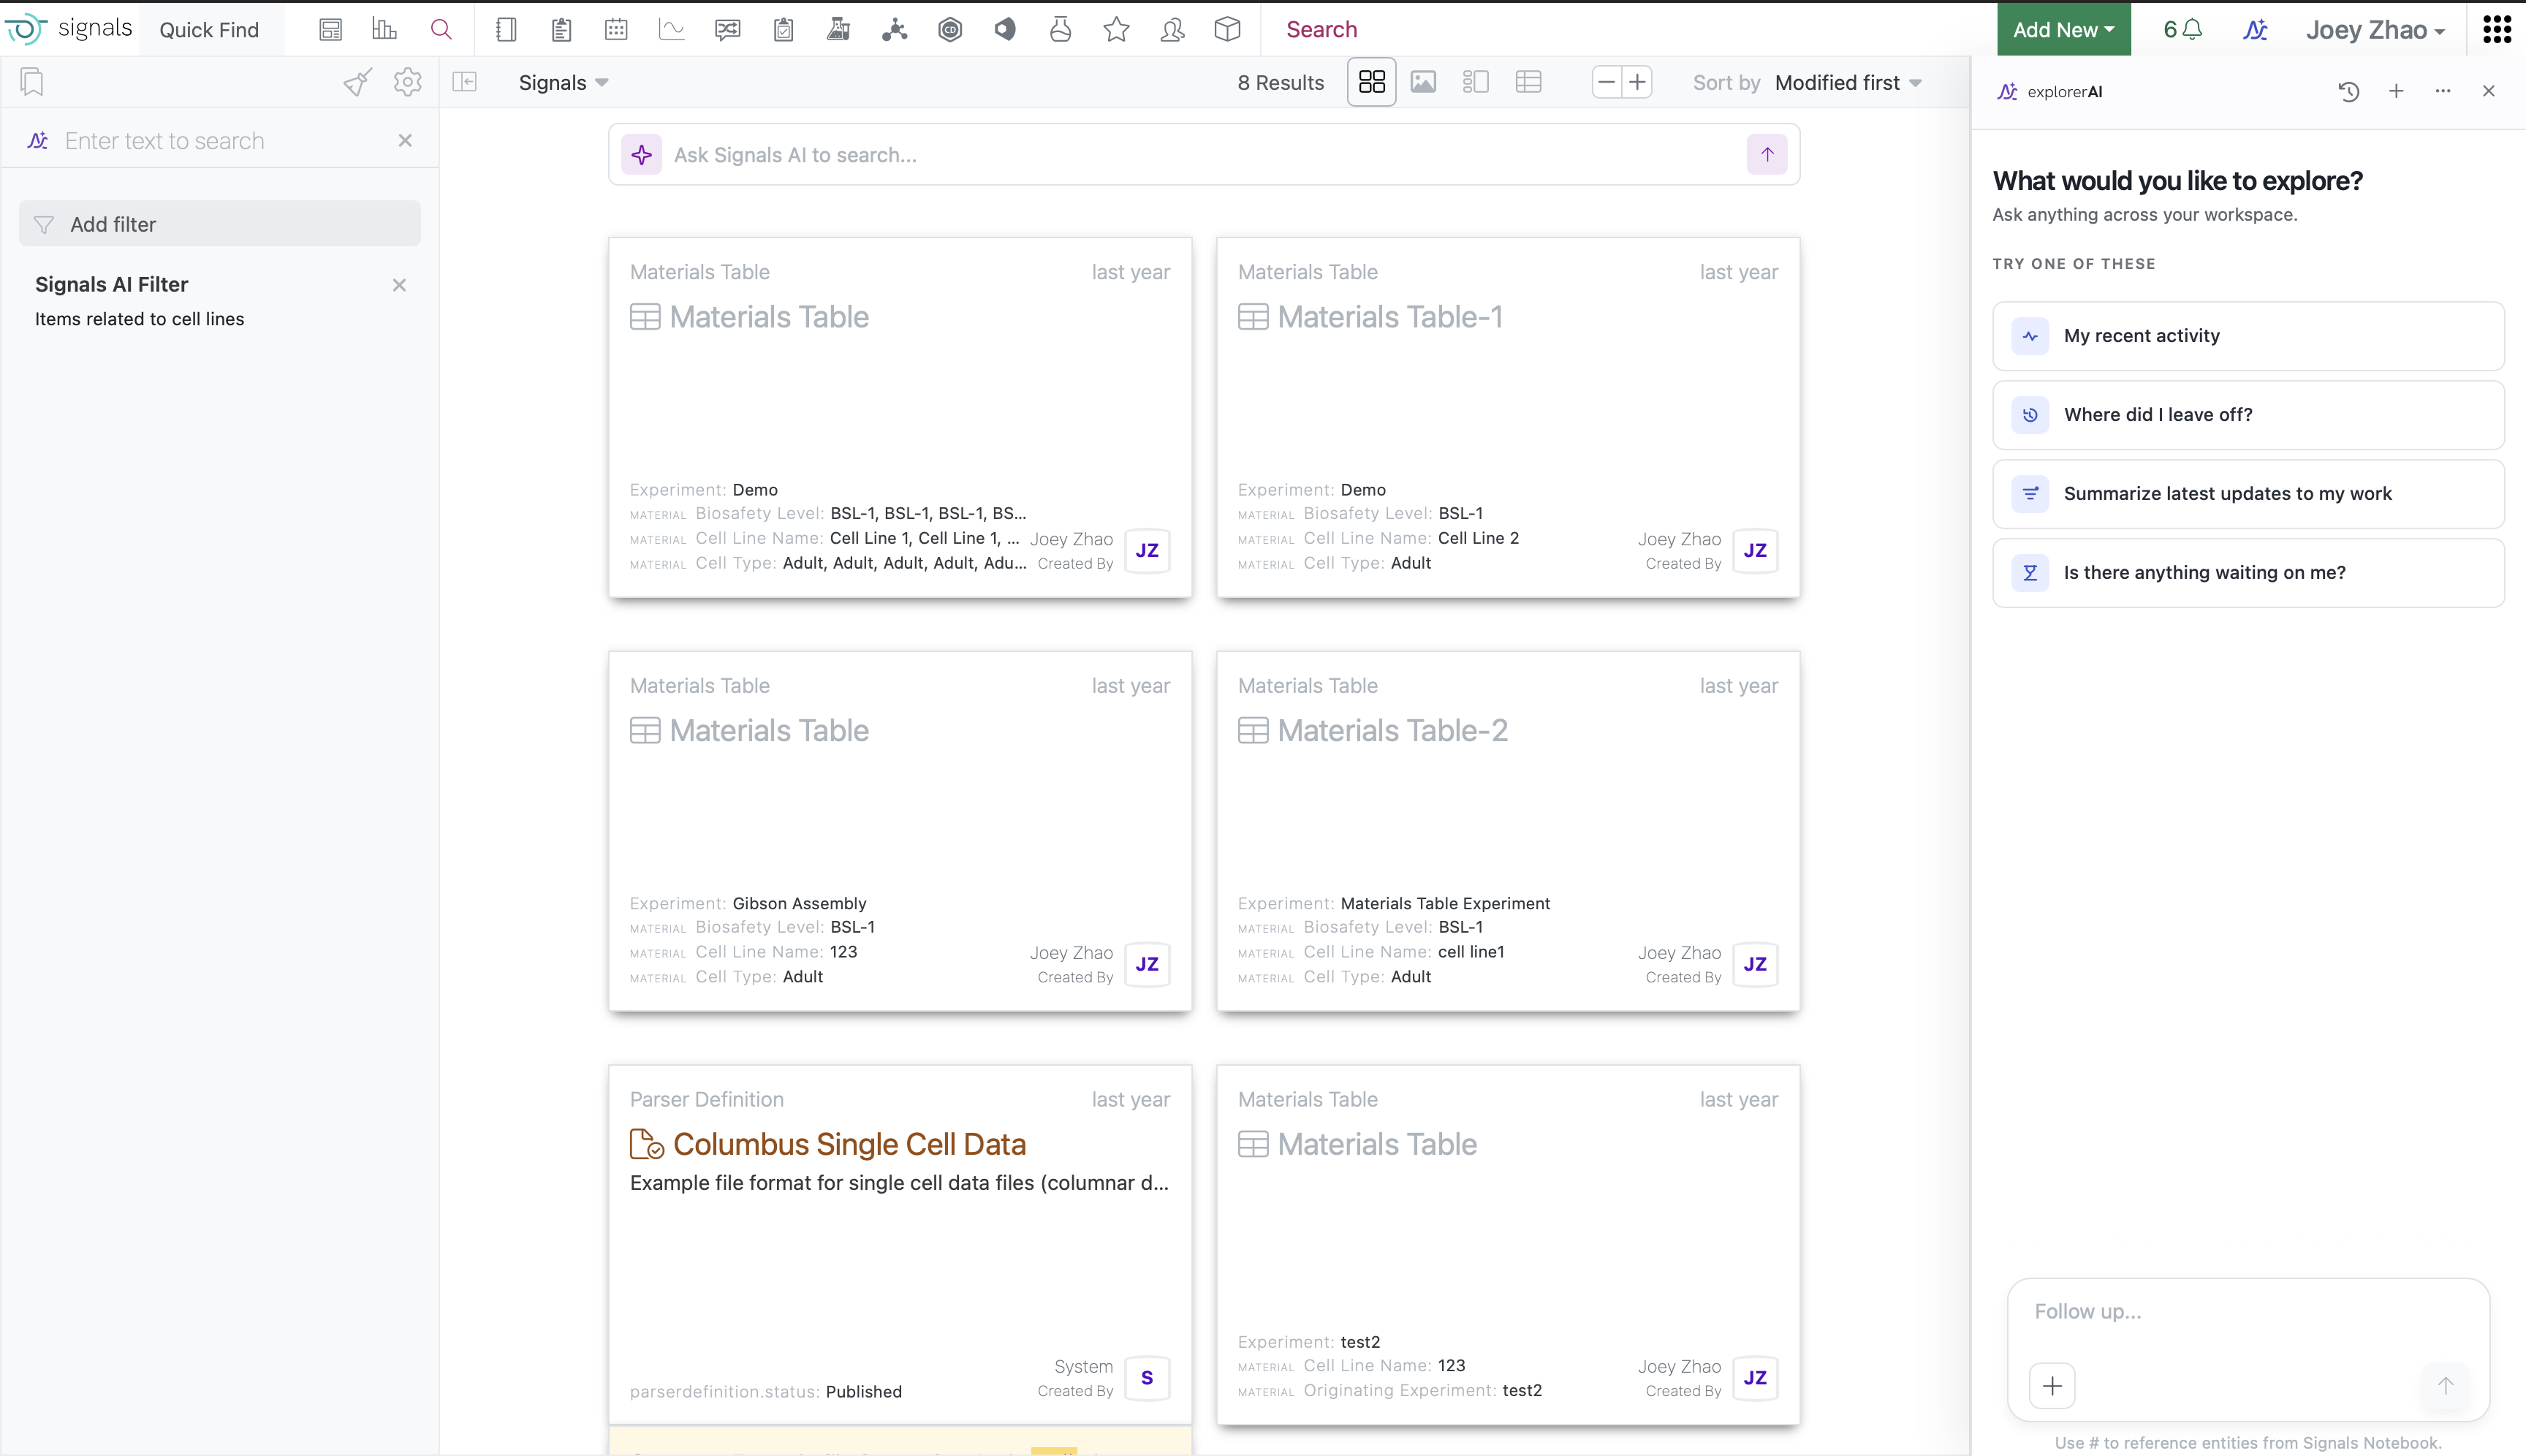
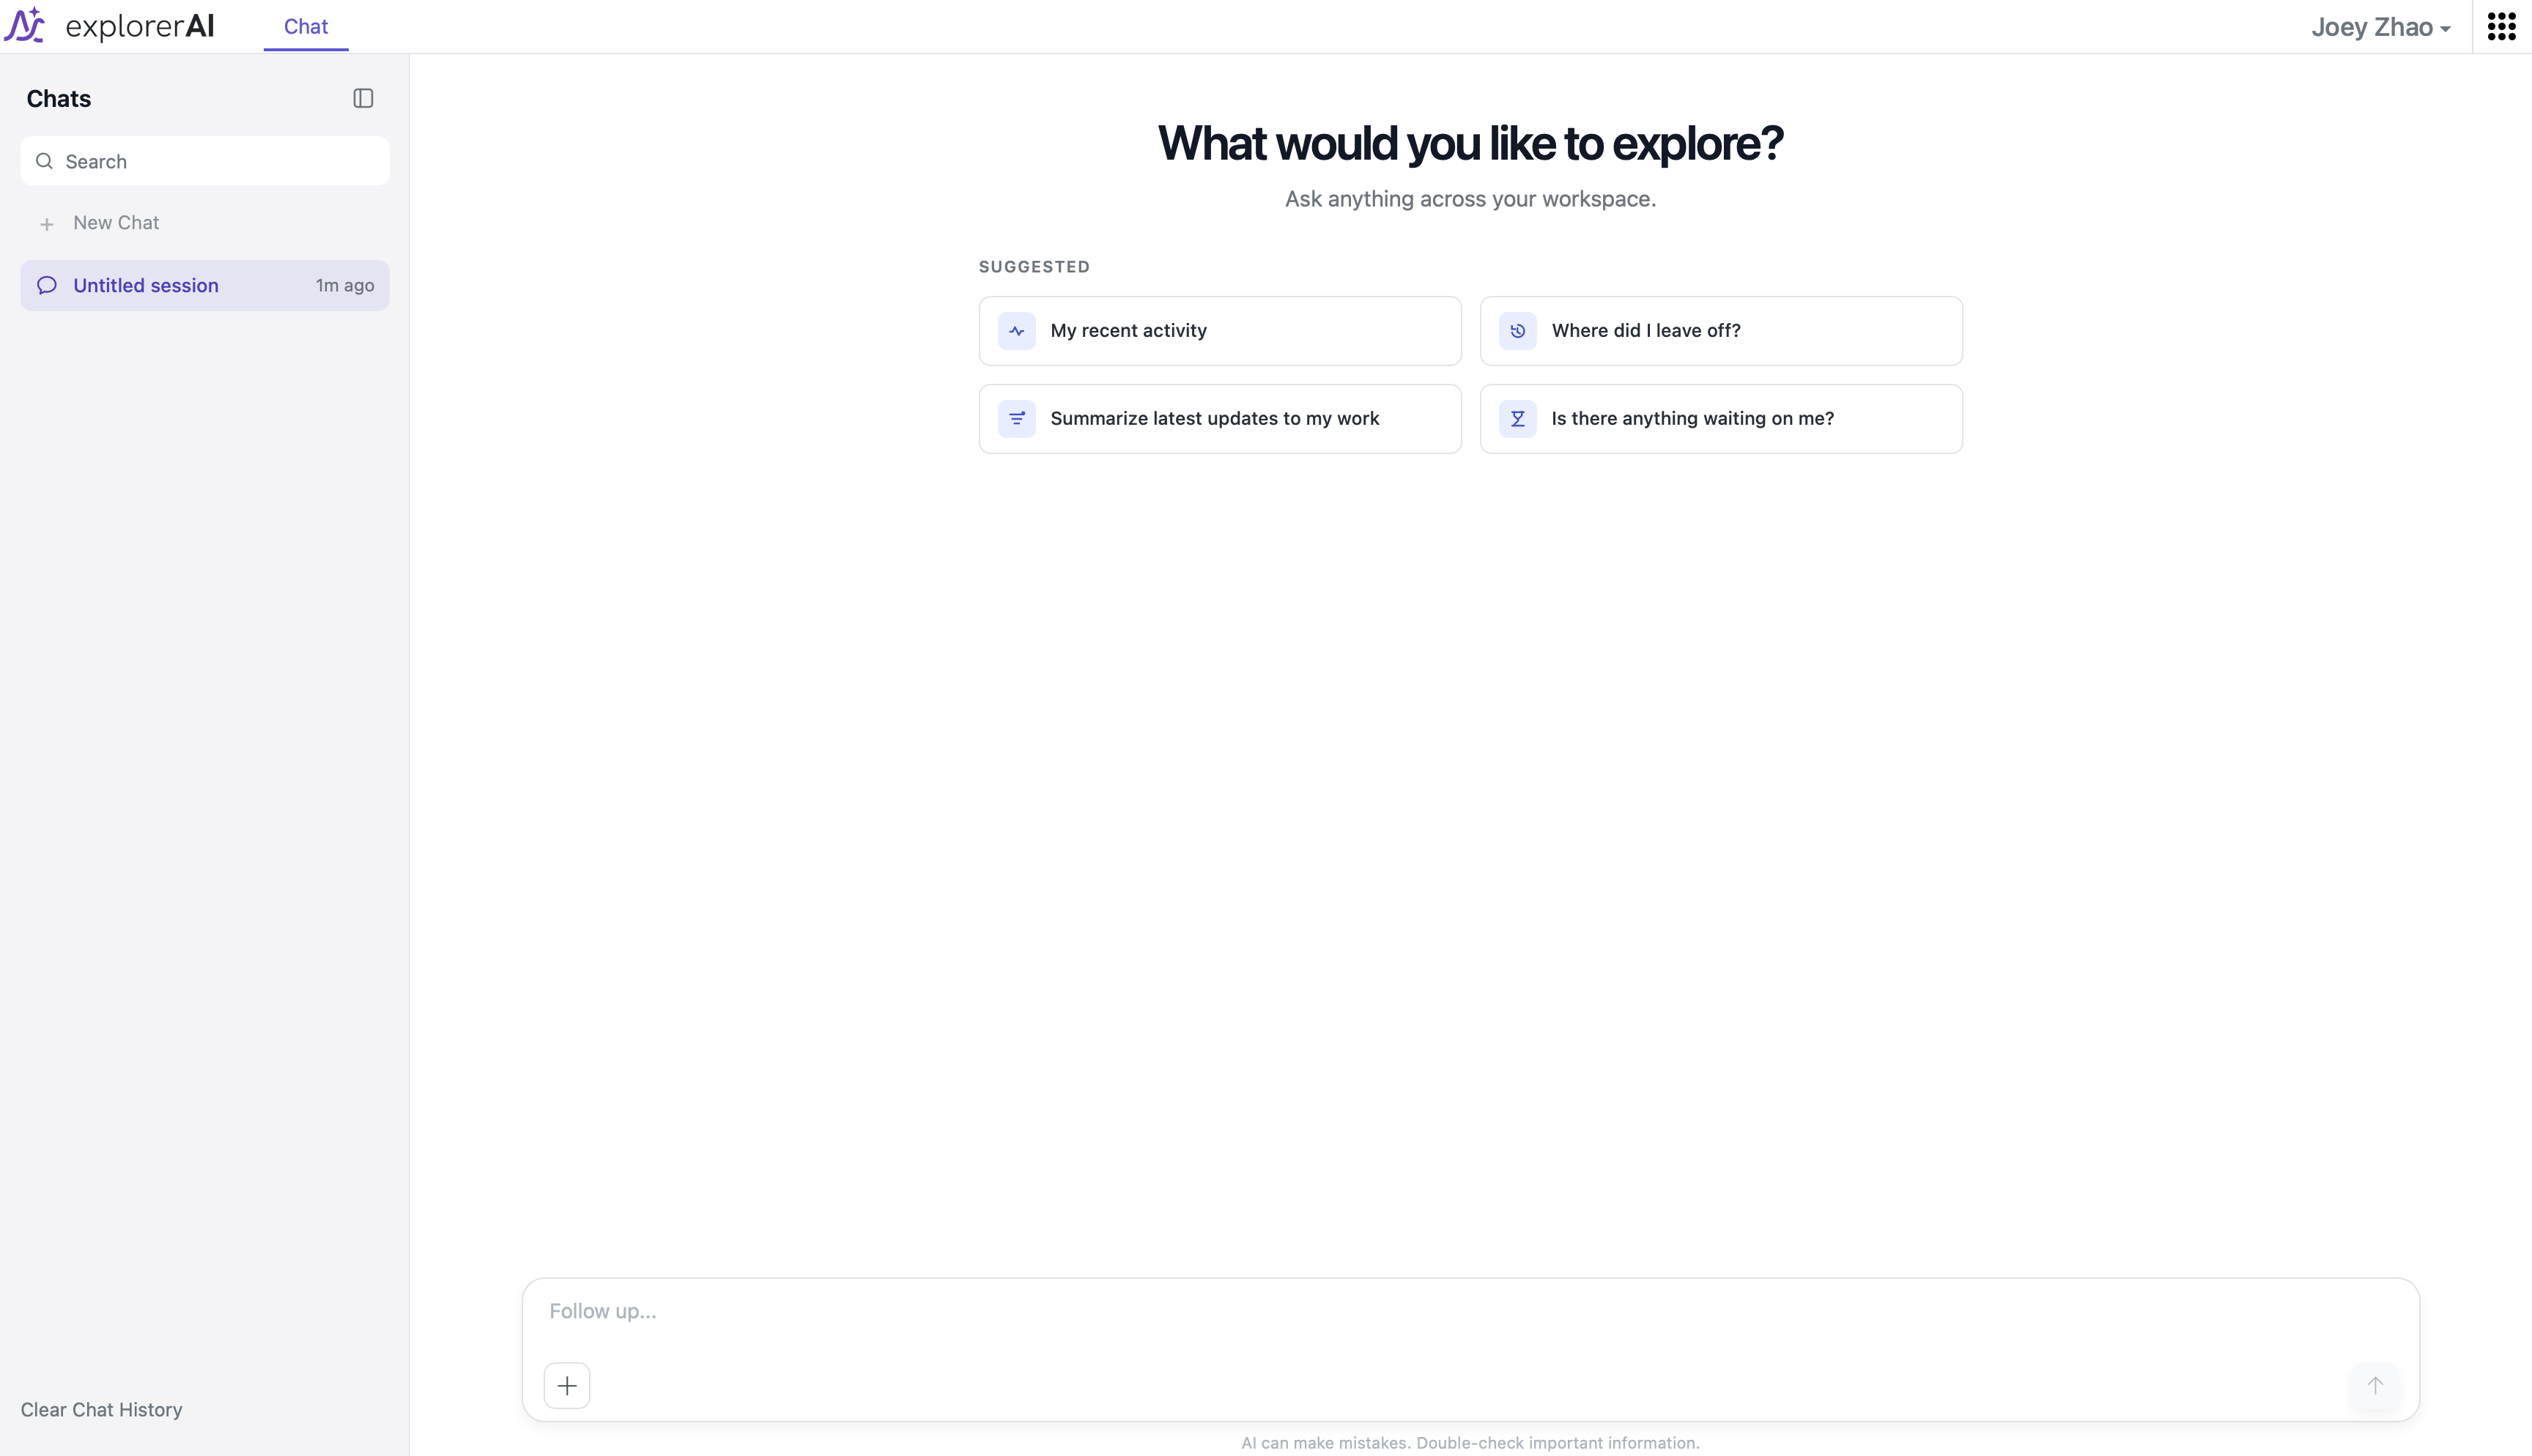
看这张截图。有人输入了一句「和细胞系相关的条目」,这句话变成了左上角一个看得见的筛选器,AI 改了什么条件,一眼能看到,也能撤掉。下面每张结果卡带着实验类型、状态、创建者和日期,点开就是原始记录。回答是从模型里出来的,落点却在这个工作区自己的实验里。
开头那张截图是我在演示环境里自己截的,左栏还留着截屏前试问题的会话记录。输入框下面那行小字,说的就是 AI 可能出错、重要信息请自己核验。它是我最早定下来的文案之一,第一版设计稿里就有。第一屏就承认会错,比装全知更像一个值得用的工具。
09 / SYSTEM
Signals One 是 Revvity Signals 的统一云原生研发平台。Signals AI 没有另起炉灶,它是平台自己的智能体框架。科学家过去十年录进系统的实验,第一次可以拿一句话去问。
按含义检索多年实验数据,不做关键词匹配。
把成堆的记录压成可核对的摘要,来源能点开。
用一句话描述,找到当时的实验图像。
和最强的模型伙伴一起做,首发 Claude,2026 年 7 月官宣 MCP 集成。
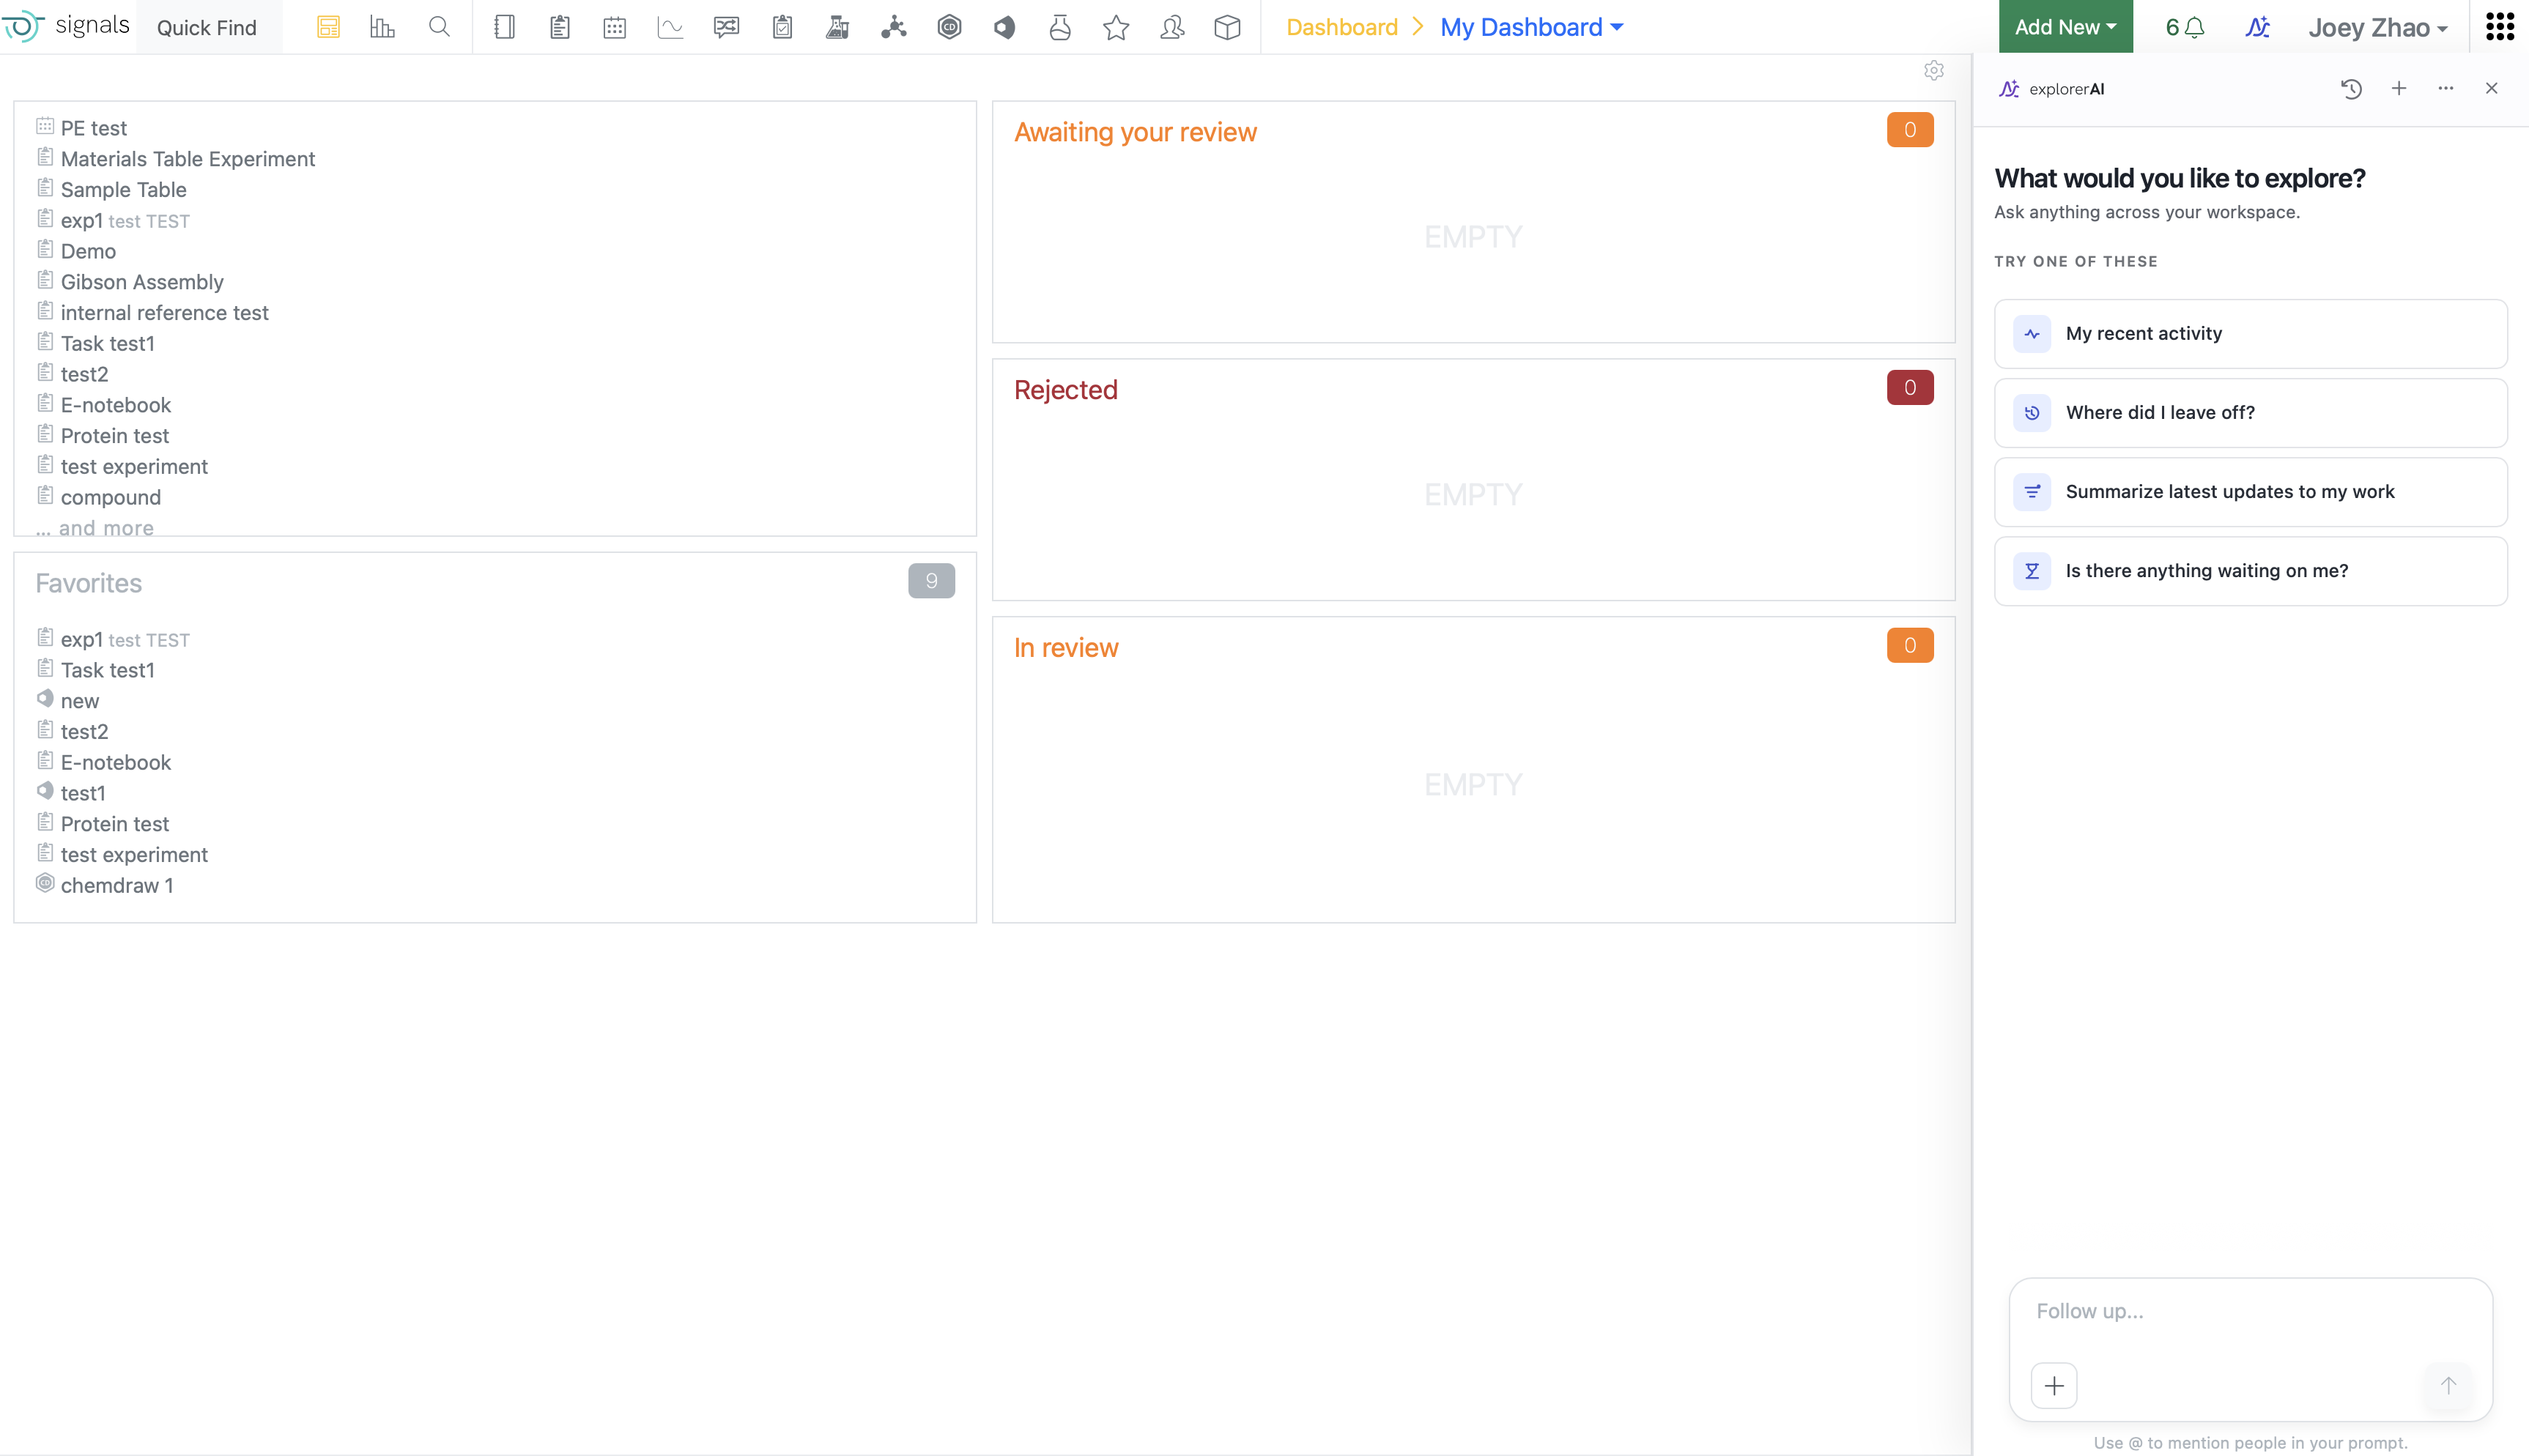
explorer AI 停在 Notebook 仪表盘右侧,不抢工作台。四张建议提问卡问的都是科学家上班会问自己的事,我最近做了什么,上次做到哪,有没有等着我审的东西。AI 长在工作发生的地方,省掉一个要切换的标签页。
10 / SHOWCASE
AI Explorer 没有做成独立产品,它站在 Signals 套件的应用阵容里,跟 Notebook、Inventory、BioDesign 平级。名字也是设计的一部分,它帮你翻自己的数据,科学还得你自己做。
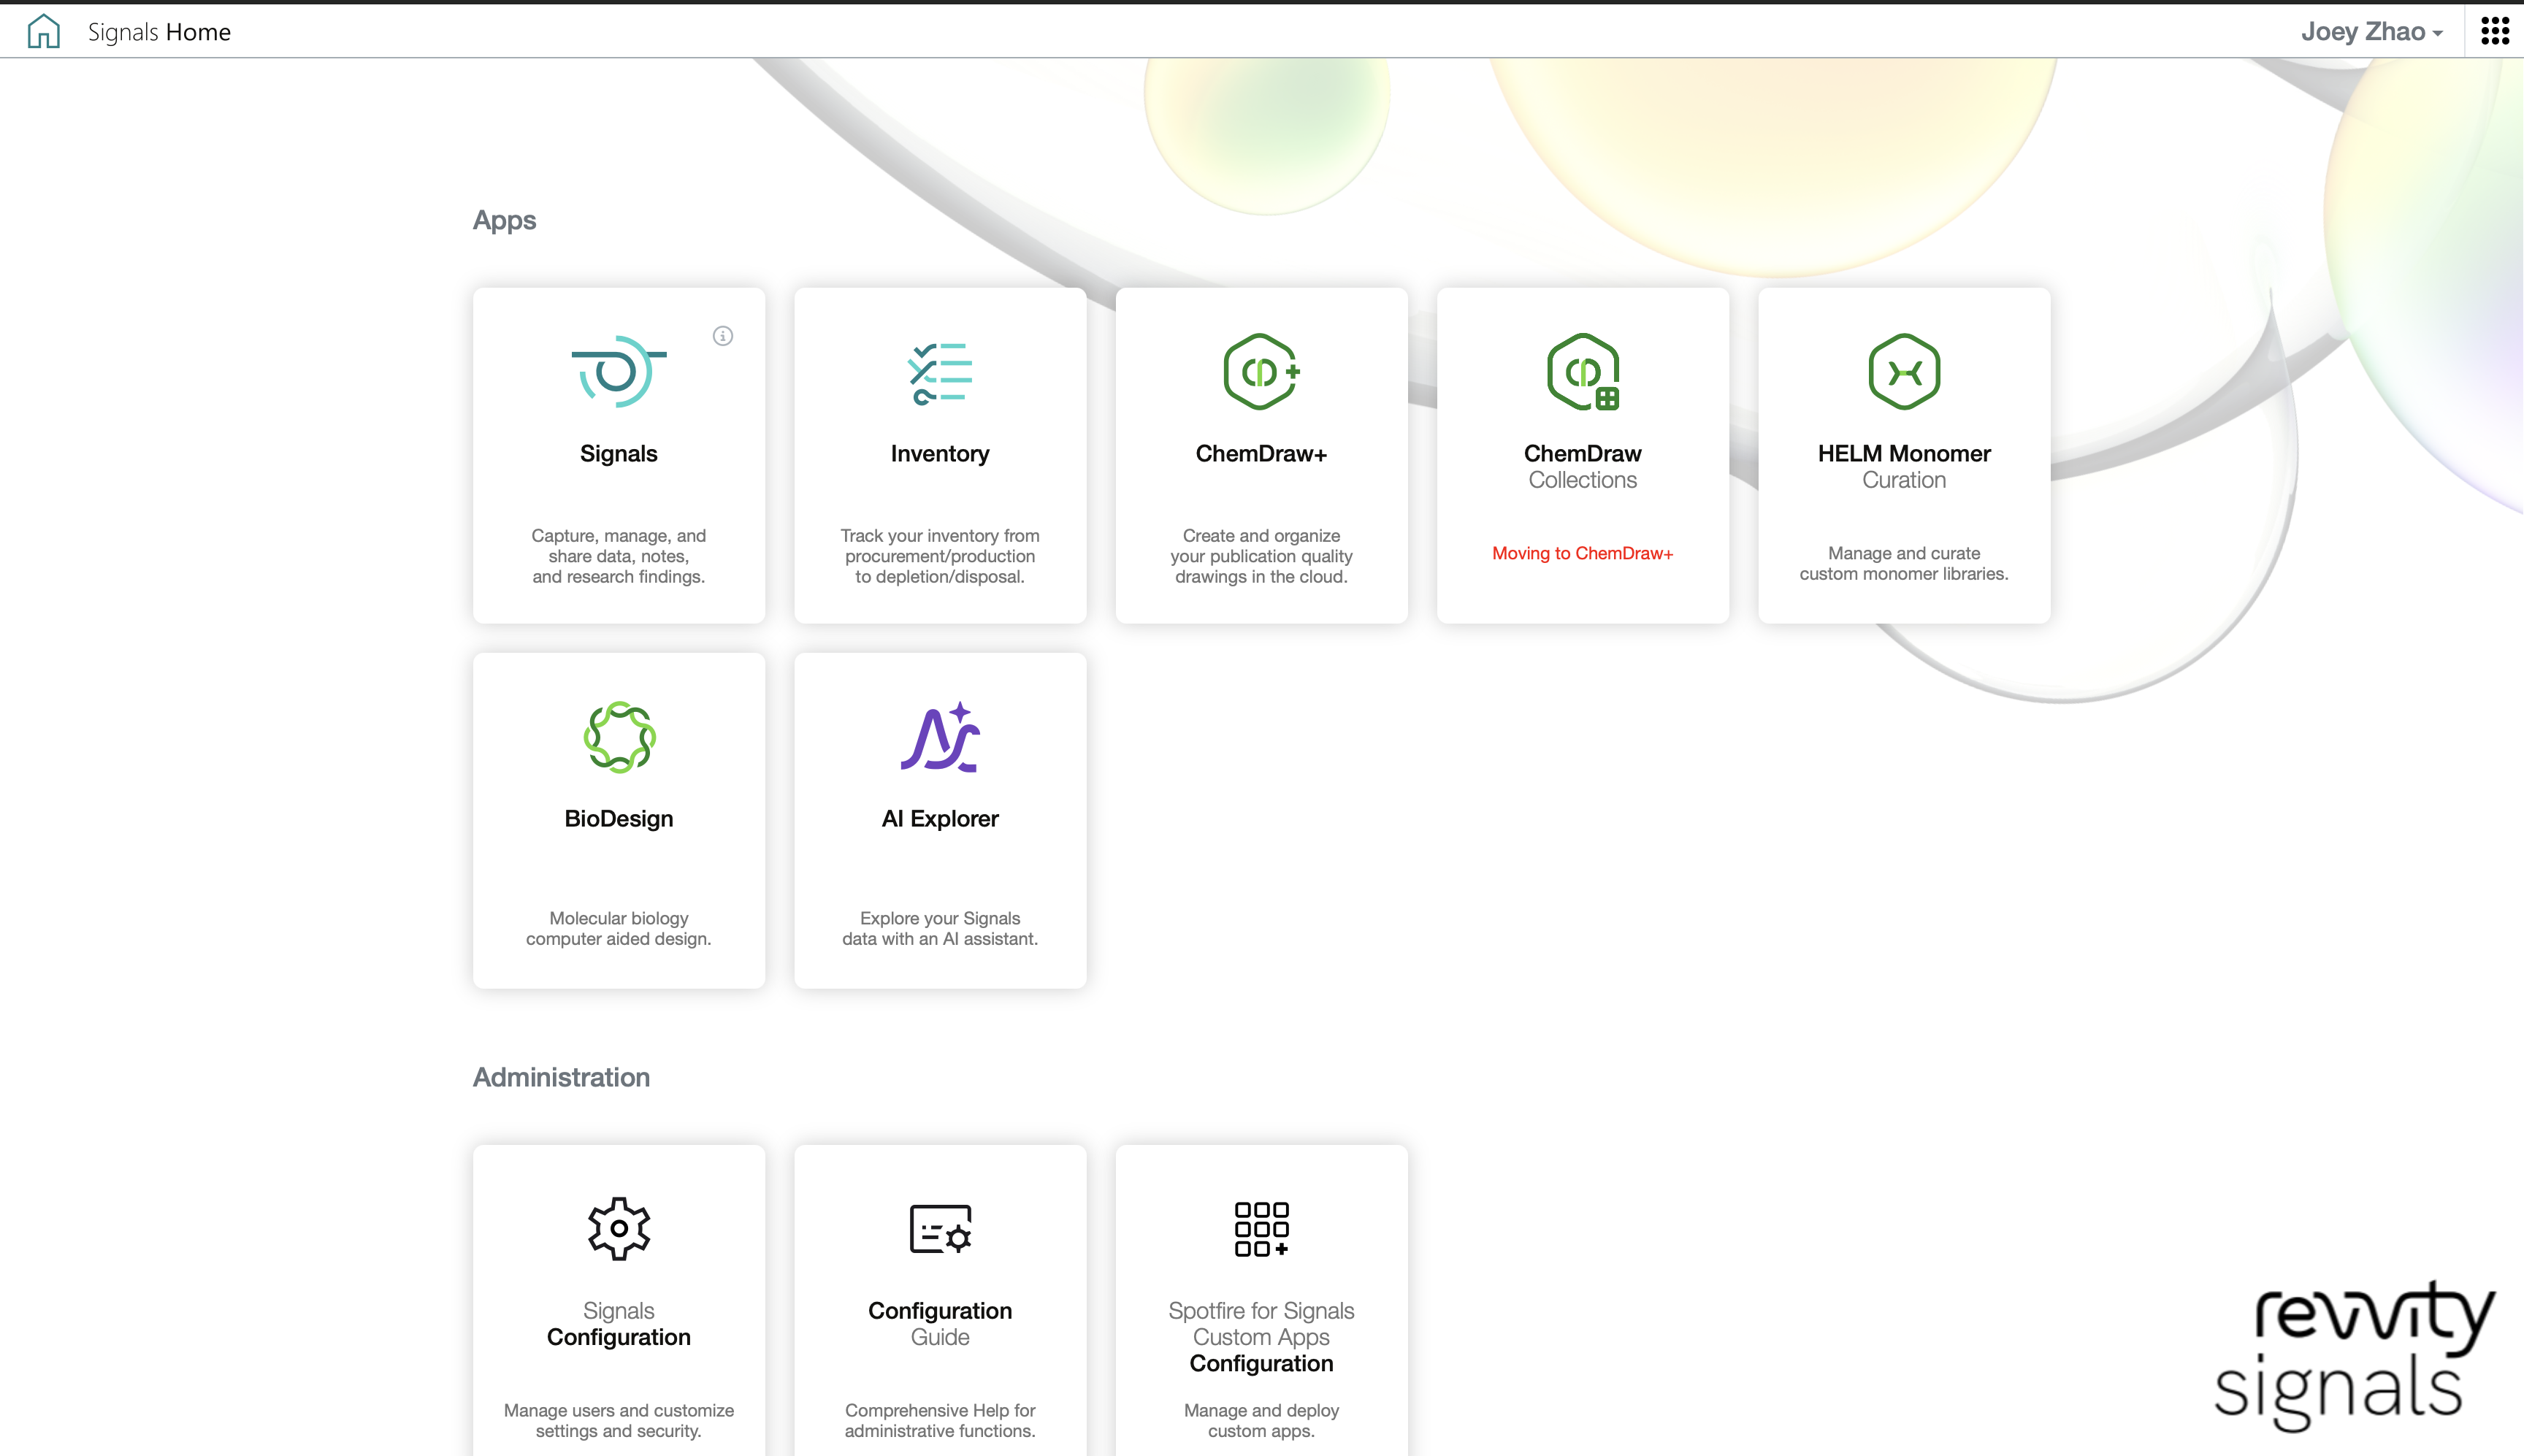
Signals Home 的应用宫格里,AI Explorer 和实验记录、库存、BioDesign 摆在同一层。页面下半排 Administration 卡片是另一半现实,权限、治理、企业合规。AI 得在这些规矩里头干活。
产品页、发布新闻稿和 Claude 合作公告都能公开访问,页面上四张界面截图截自同一个演示工作区的真实产品。
以上是公开可查的产品事实。设计过程、内部迭代和我角色的细节,是我的一面之词。
11 / THE BOUNDARY
这个页面混着两种东西,我把线画清楚。外部事实这一半,Signals AI 2026 年 6 月 22 日公开发布,产品页和新闻稿谁都能点开,Claude 集成是 7 月官宣的,都能验证。我的叙述这一半,界面怎么定、文案怎么磨、团队里怎么商量,没有公开材料能对账,你只能决定信不信我。产品刚发布,我不编采用率和留存。前半段那个 -66%,量的是五年前谱系工作流的任务测试,放在今天的 AI 身上不算数。Signals AI 部分的四张截图都来自演示工作区,里面没有一行客户数据。
「能查证的我都挂了链接。剩下的部分,你只能先听我讲。」
PUBLIC EVIDENCE · 2026.06.22 LAUNCH / 2026.07 CLAUDE × MCP / DEMO-WORKSPACE SCREENSHOTS
12 / MY ROLE
前半段,我负责谱系工作流的端到端设计,从用户访谈、信息架构、线框和原型,到可用性测试和工程交接。后半段,我负责 Signals AI 的体验层,对话怎么问、结果怎么摆、筛选器怎么让人看见、AI 从哪里进入套件。
角色边界。这些产品不是我一个人做出来的。谱系的优先级和发布节奏,是我和 PM、工程一起定的;Signals AI 的模型、本体论和平台工程有专门的团队。我管的一直是体验层,科学家在哪里碰到工具、怎么开口问、答案怎么自证清白。这页上所有关于设计的说法,都适用这条边界。
13 / LIVE
Signals AI 已经跟着 Signals One 平台公开发布。右边每条证据都能自己点开验证,这也是这个案例想示范的事。